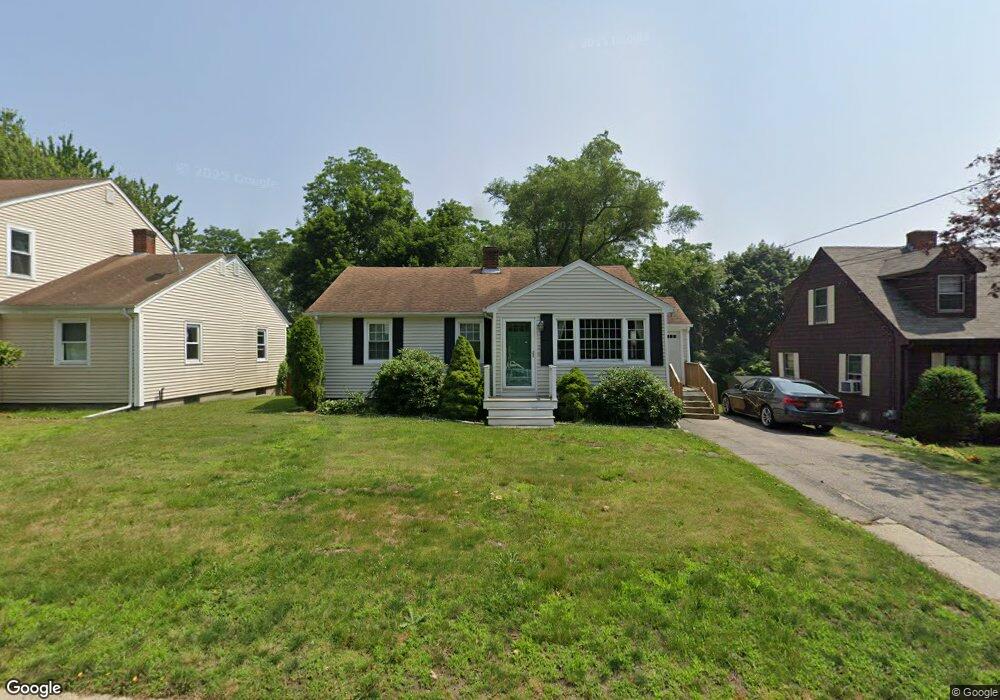
174 Bay View Ave Bristol, RI 02809
Downtown Bristol NeighborhoodEstimated Value: $410,554 - $537,000
2
Beds
1
Bath
1,107
Sq Ft
$428/Sq Ft
Est. Value
About This Home
This home is located at 174 Bay View Ave, Bristol, RI 02809 and is currently estimated at $473,389, approximately $427 per square foot. 174 Bay View Ave is a home located in Bristol County with nearby schools including Mt. Hope High School, Our Lady of Mt. Carmel School, and East Bay Career Academy.
Ownership History
Date
Name
Owned For
Owner Type
Purchase Details
Closed on
Jul 14, 2014
Sold by
Carreiro Alvaro F and Carreiro V A
Bought by
Carreiro Ft
Current Estimated Value
Purchase Details
Closed on
Oct 30, 2008
Sold by
Knuth Eric and Knuth Lauren
Bought by
Suntrust Mortgage Co
Purchase Details
Closed on
Oct 27, 2000
Sold by
Marshall Robert D and Marshall Cheryl
Bought by
Mello Thomas M and Mello Lisa
Home Financials for this Owner
Home Financials are based on the most recent Mortgage that was taken out on this home.
Original Mortgage
$132,904
Interest Rate
7.83%
Purchase Details
Closed on
Jul 28, 1999
Sold by
Deluca Michael E
Bought by
Marshall Robert D and Marshall Cheryl
Home Financials for this Owner
Home Financials are based on the most recent Mortgage that was taken out on this home.
Original Mortgage
$111,500
Interest Rate
7.61%
Create a Home Valuation Report for This Property
The Home Valuation Report is an in-depth analysis detailing your home's value as well as a comparison with similar homes in the area
Home Values in the Area
Average Home Value in this Area
Purchase History
| Date | Buyer | Sale Price | Title Company |
|---|---|---|---|
| Carreiro Ft | -- | -- | |
| Suntrust Mortgage Co | -- | -- | |
| Mello Thomas M | $134,000 | -- | |
| Marshall Robert D | $113,000 | -- |
Source: Public Records
Mortgage History
| Date | Status | Borrower | Loan Amount |
|---|---|---|---|
| Previous Owner | Marshall Robert D | $265,000 | |
| Previous Owner | Marshall Robert D | $140,000 | |
| Previous Owner | Marshall Robert D | $132,904 | |
| Previous Owner | Marshall Robert D | $111,500 |
Source: Public Records
Tax History Compared to Growth
Tax History
| Year | Tax Paid | Tax Assessment Tax Assessment Total Assessment is a certain percentage of the fair market value that is determined by local assessors to be the total taxable value of land and additions on the property. | Land | Improvement |
|---|---|---|---|---|
| 2025 | $3,760 | $272,100 | $134,500 | $137,600 |
| 2024 | $3,760 | $272,100 | $134,500 | $137,600 |
| 2023 | $3,635 | $272,100 | $134,500 | $137,600 |
| 2022 | $3,537 | $272,100 | $134,500 | $137,600 |
| 2021 | $3,106 | $216,000 | $110,500 | $105,500 |
| 2020 | $3,039 | $216,000 | $110,500 | $105,500 |
| 2019 | $2,964 | $216,000 | $110,500 | $105,500 |
| 2018 | $3,394 | $220,700 | $116,600 | $104,100 |
| 2017 | $2,835 | $190,000 | $105,400 | $84,600 |
| 2016 | $2,806 | $190,000 | $105,400 | $84,600 |
| 2015 | $2,666 | $190,000 | $105,400 | $84,600 |
| 2014 | $2,976 | $227,840 | $138,300 | $89,540 |
Source: Public Records
Map
Nearby Homes
- 70 Magnolia St
- 214 Franklin St
- 2 Chilton St
- 2 Wilson St
- 22 Magnolia St
- 17 Rock St
- 107 Franklin St
- 413 High St
- 291 High St
- 53 Catherine St
- 44 Bradford St Unit 48
- 44 Bradford St Unit 49
- 44 Bradford St Unit 52
- 21 Bradford St Unit 2
- 82 Charles St
- 6 Violet Ct
- 18 State St Unit 5 (3rd Floor East)
- 341 Thames St Unit 109
- 79 Hopeworth Ave
- 3 Chestnut St
- 174 Bayview Ave
- 176 Bay View Ave
- 172 Bayview Ave
- 172 Bay View Ave
- 170 Bay View Ave
- 175 Bay View Ave
- 179 Bay View Ave
- 166 Bay View Ave
- 165 Bay View Ave
- 180 Bay View Ave
- 184 Bay View Ave
- 163 Bay View Ave
- 0 George St
- 162 Bay View Ave
- 0 Bay View Ave
- 3 Rego Ave
- 188 Bay View Ave
- 188 Bayview Ave
- 5 Rego Ave
- 12 George St