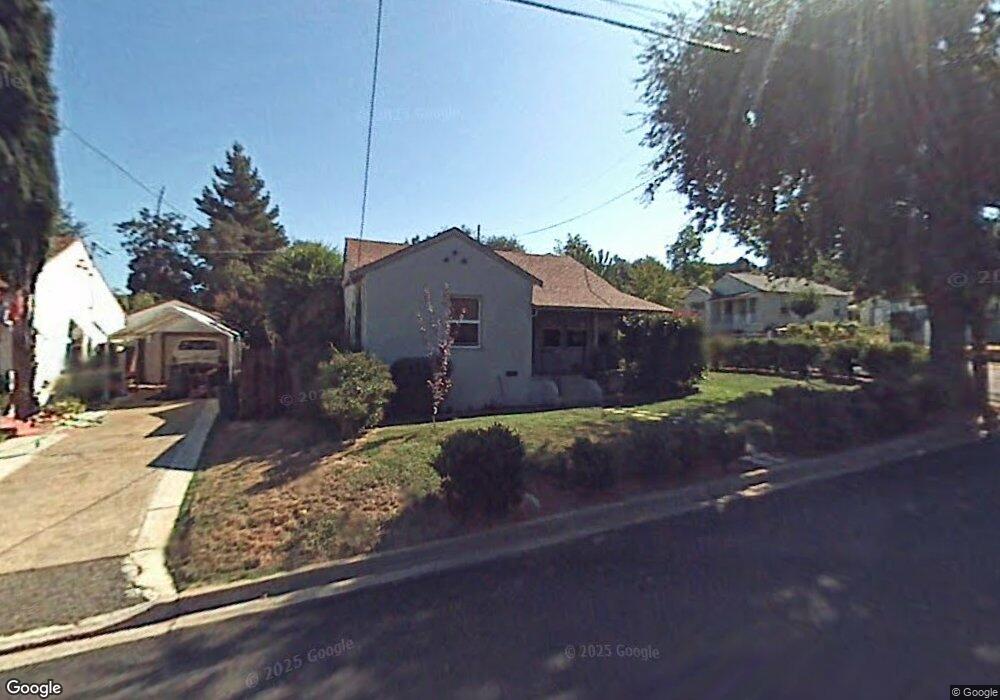
174 Highland Dr Sutter Creek, CA 95685
Estimated Value: $350,000 - $404,000
2
Beds
1
Bath
954
Sq Ft
$392/Sq Ft
Est. Value
About This Home
This home is located at 174 Highland Dr, Sutter Creek, CA 95685 and is currently estimated at $374,360, approximately $392 per square foot. 174 Highland Dr is a home located in Amador County with nearby schools including Sutter Creek Elementary School, Ione Junior High School, and Amador High School.
Ownership History
Date
Name
Owned For
Owner Type
Purchase Details
Closed on
Oct 5, 2022
Sold by
Mara Treadway French Revocable Trust
Bought by
Flint Dianne E
Current Estimated Value
Purchase Details
Closed on
Feb 4, 2021
Sold by
Flint Dianne E
Bought by
Flint Dianne E
Purchase Details
Closed on
Apr 29, 2020
Sold by
French Mara Treadway
Bought by
Flint Diann E
Home Financials for this Owner
Home Financials are based on the most recent Mortgage that was taken out on this home.
Original Mortgage
$313,500
Interest Rate
3.6%
Mortgage Type
New Conventional
Purchase Details
Closed on
Jul 6, 2010
Sold by
Waterston Darren R
Bought by
Revocabl French Mara Treadway
Create a Home Valuation Report for This Property
The Home Valuation Report is an in-depth analysis detailing your home's value as well as a comparison with similar homes in the area
Home Values in the Area
Average Home Value in this Area
Purchase History
| Date | Buyer | Sale Price | Title Company |
|---|---|---|---|
| Flint Dianne E | -- | Western Land Title | |
| Flint Dianne E | -- | None Available | |
| Flint Diann E | $330,000 | Western Land Title Co Inc | |
| Revocabl French Mara Treadway | $200,000 | Western Land Title Co Inc |
Source: Public Records
Mortgage History
| Date | Status | Borrower | Loan Amount |
|---|---|---|---|
| Previous Owner | Flint Diann E | $313,500 |
Source: Public Records
Tax History Compared to Growth
Tax History
| Year | Tax Paid | Tax Assessment Tax Assessment Total Assessment is a certain percentage of the fair market value that is determined by local assessors to be the total taxable value of land and additions on the property. | Land | Improvement |
|---|---|---|---|---|
| 2025 | $3,510 | $360,898 | $98,426 | $262,472 |
| 2024 | $3,510 | $353,823 | $96,497 | $257,326 |
| 2023 | $3,440 | $346,886 | $94,605 | $252,281 |
| 2022 | $3,445 | $340,085 | $92,750 | $247,335 |
| 2021 | $3,379 | $333,418 | $90,932 | $242,486 |
| 2020 | $2,559 | $252,320 | $134,716 | $117,604 |
| 2019 | $2,508 | $247,374 | $132,075 | $115,299 |
| 2018 | $2,460 | $242,525 | $129,486 | $113,039 |
| 2017 | $2,413 | $237,771 | $126,948 | $110,823 |
| 2016 | $2,366 | $233,109 | $124,459 | $108,650 |
| 2015 | $2,333 | $229,608 | $122,590 | $107,018 |
| 2014 | $2,286 | $225,111 | $120,189 | $104,922 |
Source: Public Records
Map
Nearby Homes
- 214 Lorinda Dr
- 150 Foothill Dr
- 236 Highland Dr
- 97 Dennis St
- 125 Raylan Dr
- 100 Dennis St
- 52-D David Dr
- 52-A David Dr
- 52-B David Dr
- 52-C David Dr
- 0 David Dr Unit 225042788
- 101 Karsan Dr
- 159 Mesa de Oro Cir
- 96 Mesa de Oro Cir
- 171 Mesa de Oro Cir
- 65 Mesa de Oro Cir
- 69 Mesa de Oro Cir
- 30 Bryson Dr
- 105 Bryson Dr
- 11900 Sutter Hill Rd
- 168 Highland Dr
- 0 Parcel C Morning Star Court Parcel C
- 0 PARCEL D Morning Star Court Lot D
- 162 Highland Dr
- 46 Ruby St
- 161 Foothill Dr
- 50 Ruby St
- 165 Highland Dr
- 42 Ruby St
- 155 Foothill Dr
- 185 Highland Dr
- 38 Ruby St
- 147 Foothill Dr
- 34 Ruby St
- 156 Highland Dr
- 150 Highland Dr
- 194 Highland Dr
- 168 Lorinda Dr
- 39 Mountain View Dr
- 139 Foothill Dr