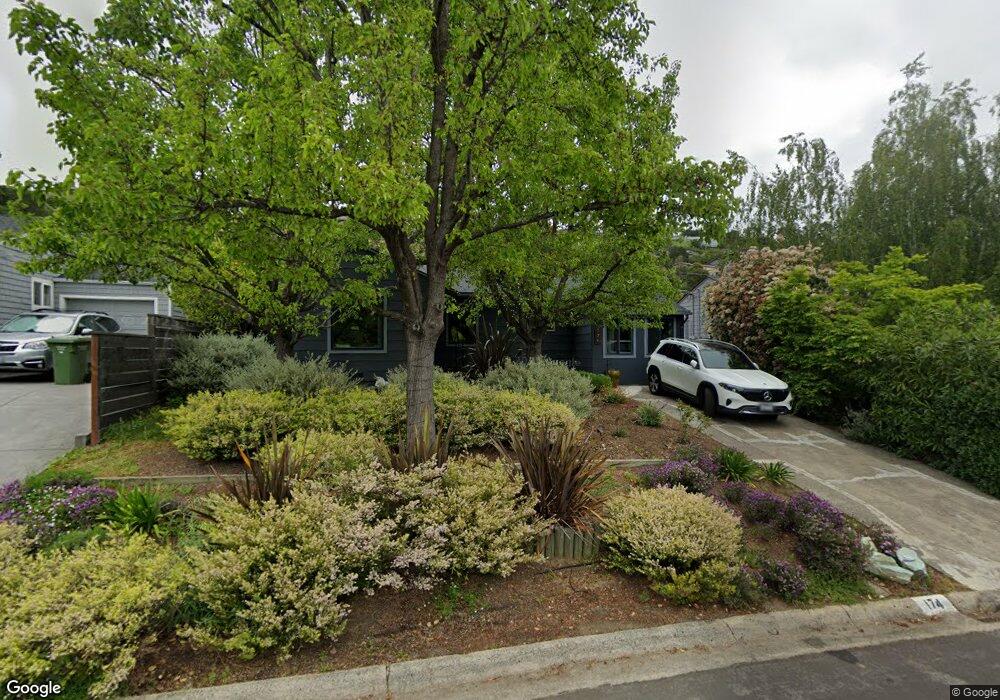
174 Solano St San Rafael, CA 94901
Sun Valley NeighborhoodEstimated Value: $1,152,000 - $1,230,000
2
Beds
1
Bath
905
Sq Ft
$1,317/Sq Ft
Est. Value
About This Home
This home is located at 174 Solano St, San Rafael, CA 94901 and is currently estimated at $1,192,010, approximately $1,317 per square foot. 174 Solano St is a home located in Marin County with nearby schools including Sun Valley Elementary School, James B. Davidson Middle School, and San Rafael High School.
Ownership History
Date
Name
Owned For
Owner Type
Purchase Details
Closed on
Apr 30, 2019
Sold by
Fasoletti Dario E and Fasoletti Diane L
Bought by
Bamberger Cameron
Current Estimated Value
Home Financials for this Owner
Home Financials are based on the most recent Mortgage that was taken out on this home.
Original Mortgage
$726,525
Outstanding Balance
$637,726
Interest Rate
4.12%
Mortgage Type
Adjustable Rate Mortgage/ARM
Estimated Equity
$554,284
Purchase Details
Closed on
Jul 16, 2001
Sold by
Nokes Paula and Mcgowan Mark
Bought by
Fasoletti Dario E and Fasoletti Diane L
Home Financials for this Owner
Home Financials are based on the most recent Mortgage that was taken out on this home.
Original Mortgage
$380,000
Interest Rate
7.95%
Purchase Details
Closed on
Jul 18, 2000
Sold by
Jensen Leone and Mcgowan 1999 Revocabl Elaine M
Bought by
Nokes Paula and Mcgowan Mark
Purchase Details
Closed on
Sep 3, 1999
Sold by
Mcgowan Elaine M
Bought by
Jensen Leone and Mcgowan 1999 Revocabl Elaine M
Create a Home Valuation Report for This Property
The Home Valuation Report is an in-depth analysis detailing your home's value as well as a comparison with similar homes in the area
Home Values in the Area
Average Home Value in this Area
Purchase History
| Date | Buyer | Sale Price | Title Company |
|---|---|---|---|
| Bamberger Cameron | $935,000 | Old Republic Title Company | |
| Fasoletti Dario E | -- | California Land Title | |
| Nokes Paula | -- | -- | |
| Jensen Leone | -- | -- |
Source: Public Records
Mortgage History
| Date | Status | Borrower | Loan Amount |
|---|---|---|---|
| Open | Bamberger Cameron | $726,525 | |
| Previous Owner | Fasoletti Dario E | $380,000 | |
| Closed | Fasoletti Dario E | $95,000 |
Source: Public Records
Tax History Compared to Growth
Tax History
| Year | Tax Paid | Tax Assessment Tax Assessment Total Assessment is a certain percentage of the fair market value that is determined by local assessors to be the total taxable value of land and additions on the property. | Land | Improvement |
|---|---|---|---|---|
| 2025 | $14,303 | $1,063,460 | $725,075 | $338,385 |
| 2024 | $14,303 | $1,027,903 | $710,859 | $317,044 |
| 2023 | $14,060 | $1,007,752 | $696,923 | $310,829 |
| 2022 | $13,285 | $987,995 | $683,260 | $304,735 |
| 2021 | $13,073 | $968,624 | $669,864 | $298,760 |
| 2020 | $12,945 | $958,700 | $663,000 | $295,700 |
| 2019 | $9,024 | $629,018 | $410,517 | $218,501 |
| 2018 | $8,933 | $616,686 | $402,469 | $214,217 |
| 2017 | $8,604 | $604,598 | $394,580 | $210,018 |
| 2016 | $8,311 | $592,746 | $386,845 | $205,901 |
| 2015 | $7,945 | $583,845 | $381,036 | $202,809 |
| 2014 | $7,611 | $572,412 | $373,574 | $198,838 |
Source: Public Records
Map
Nearby Homes
- 241 Humboldt St
- 272 Center St
- 2323 5th Ave
- 40 Leafwood Cir
- 55 Bayo Vista Way
- 65 Circle Rd
- 48 Ranch Rd
- 31 Indian Rd
- 2016 4th St
- 119 Oakmont Ave
- 1 Hilldale Dr
- 16 Oakmont Ave
- 51 El Camino Ave
- 135 Spring Grove Ave
- 29 Red Rock Way
- 5 W Hillside Ave
- 21 Red Rock Way
- 102 F St
- 0 Chula Vista Dr Unit 325048501
- 0 Chula Vista Dr Unit 325048505