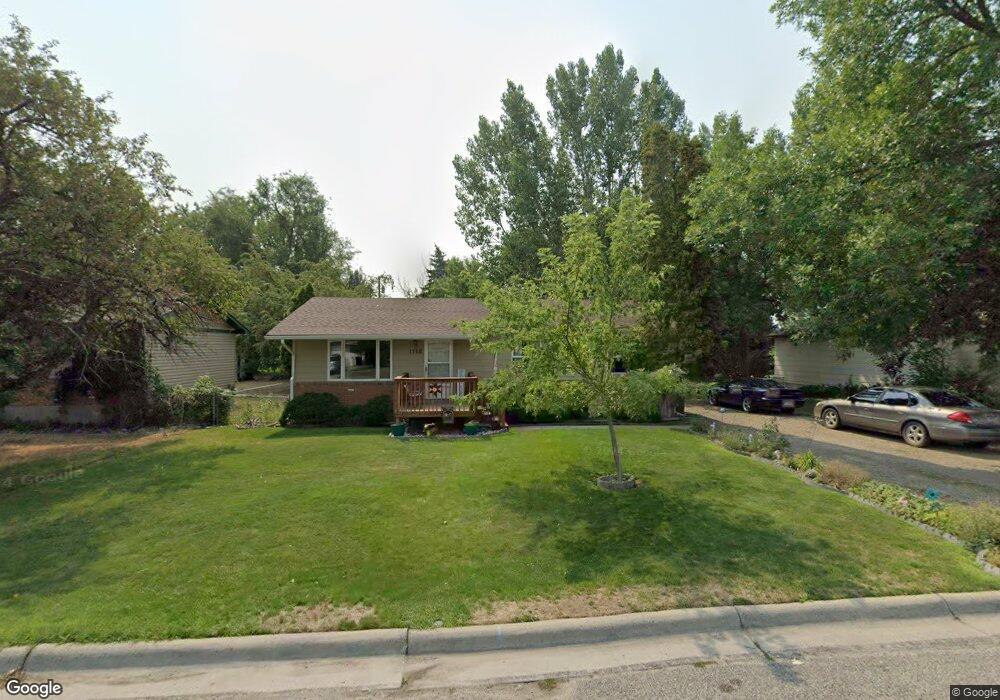
1740 Maurine St Billings, MT 59105
Billings Heights NeighborhoodEstimated Value: $306,000 - $330,000
3
Beds
2
Baths
1,008
Sq Ft
$318/Sq Ft
Est. Value
About This Home
This home is located at 1740 Maurine St, Billings, MT 59105 and is currently estimated at $320,565, approximately $318 per square foot. 1740 Maurine St is a home located in Yellowstone County with nearby schools including Beartooth School, Medicine Crow Middle School, and Skyview High School.
Ownership History
Date
Name
Owned For
Owner Type
Purchase Details
Closed on
Jun 29, 2022
Sold by
Zwick Marion
Bought by
Simenson Joshua and Simenson Chantal
Current Estimated Value
Home Financials for this Owner
Home Financials are based on the most recent Mortgage that was taken out on this home.
Original Mortgage
$255,138
Outstanding Balance
$243,068
Interest Rate
5.25%
Mortgage Type
FHA
Estimated Equity
$77,497
Purchase Details
Closed on
Nov 21, 2014
Sold by
Breiner Renee and Kierstead Annette
Bought by
Zwick Marion
Purchase Details
Closed on
Aug 15, 2007
Sold by
Zwick Marion
Bought by
Zwick Marion and Breiner Renee
Create a Home Valuation Report for This Property
The Home Valuation Report is an in-depth analysis detailing your home's value as well as a comparison with similar homes in the area
Home Values in the Area
Average Home Value in this Area
Purchase History
| Date | Buyer | Sale Price | Title Company |
|---|---|---|---|
| Simenson Joshua | -- | First Montana Title Company | |
| Zwick Marion | -- | None Available | |
| Zwick Marion | -- | None Available |
Source: Public Records
Mortgage History
| Date | Status | Borrower | Loan Amount |
|---|---|---|---|
| Open | Simenson Joshua | $255,138 |
Source: Public Records
Tax History Compared to Growth
Tax History
| Year | Tax Paid | Tax Assessment Tax Assessment Total Assessment is a certain percentage of the fair market value that is determined by local assessors to be the total taxable value of land and additions on the property. | Land | Improvement |
|---|---|---|---|---|
| 2025 | $2,655 | $278,200 | $63,046 | $215,154 |
| 2024 | $2,655 | $267,700 | $59,371 | $208,329 |
| 2023 | $2,670 | $267,700 | $59,371 | $208,329 |
| 2022 | $2,216 | $192,500 | $0 | $0 |
| 2021 | $2,110 | $192,500 | $0 | $0 |
| 2020 | $2,024 | $175,100 | $0 | $0 |
| 2019 | $1,934 | $175,100 | $0 | $0 |
| 2018 | $1,898 | $168,800 | $0 | $0 |
| 2017 | $1,563 | $168,800 | $0 | $0 |
| 2016 | $1,668 | $153,600 | $0 | $0 |
| 2015 | $1,631 | $153,600 | $0 | $0 |
| 2014 | $1,468 | $72,769 | $0 | $0 |
Source: Public Records
Map
Nearby Homes
- 1727 Wicks Ln
- 1819 Natalie St
- 1961 Bitterroot Dr
- 10 Attika St N
- 13 Hartland St N
- 6 N Bing
- 1 Rainier St N
- 4 Lapin St
- 1402 Emma Ave
- 8 Lapin St
- 1982 Sandra Dr
- 1261 Cherry Island Dr
- 1320 Mading Dr
- 1327 Tania Cir
- 1290 Cherry Island Dr
- na Hawthorne Ln
- 38 Danube St
- 1518 S Ping Cir
- 1212 Cherry Island Dr
- TBD Barrett Rd