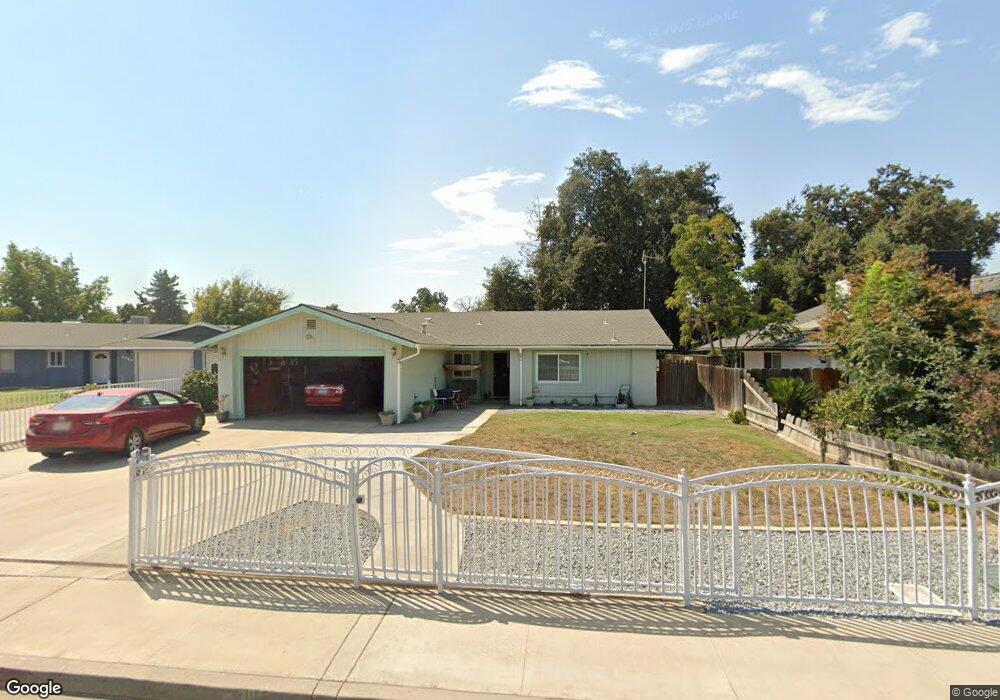
1741 S Clark St Visalia, CA 93292
South Visalia NeighborhoodEstimated Value: $303,570 - $352,000
3
Beds
2
Baths
9,999
Sq Ft
$33/Sq Ft
Est. Value
About This Home
This home is located at 1741 S Clark St, Visalia, CA 93292 and is currently estimated at $328,893, approximately $32 per square foot. 1741 S Clark St is a home located in Tulare County with nearby schools including Pinkham Elementary School, Valley Oak Middle School, and Golden West High School.
Ownership History
Date
Name
Owned For
Owner Type
Purchase Details
Closed on
Nov 3, 2009
Sold by
Steckman Alice M
Bought by
Alice M Steckman Family Trust
Current Estimated Value
Purchase Details
Closed on
May 17, 2002
Sold by
Hud
Bought by
Gutierrez Angelo L and Steckman Alice M
Purchase Details
Closed on
Jan 16, 2002
Sold by
Ctx Mtg Company Llc
Bought by
Hud
Purchase Details
Closed on
Jul 8, 1997
Sold by
Pelham Donald
Bought by
Marks Jeff R and Marks Lisa
Home Financials for this Owner
Home Financials are based on the most recent Mortgage that was taken out on this home.
Original Mortgage
$80,624
Interest Rate
7.58%
Mortgage Type
FHA
Purchase Details
Closed on
Jan 24, 1994
Sold by
Lewis John D and Lewis Joyce Mary
Bought by
Pelham Donald D and Pelham Patricia A
Create a Home Valuation Report for This Property
The Home Valuation Report is an in-depth analysis detailing your home's value as well as a comparison with similar homes in the area
Home Values in the Area
Average Home Value in this Area
Purchase History
| Date | Buyer | Sale Price | Title Company |
|---|---|---|---|
| Alice M Steckman Family Trust | -- | None Available | |
| Gutierrez Angelo L | $85,000 | Fidelity National Title Co | |
| Hud | -- | United Title Company | |
| Marks Jeff R | $81,000 | Fidelity National Title Co | |
| Pelham Donald D | $50,000 | First American Title Ins Co |
Source: Public Records
Mortgage History
| Date | Status | Borrower | Loan Amount |
|---|---|---|---|
| Previous Owner | Marks Jeff R | $80,624 |
Source: Public Records
Tax History Compared to Growth
Tax History
| Year | Tax Paid | Tax Assessment Tax Assessment Total Assessment is a certain percentage of the fair market value that is determined by local assessors to be the total taxable value of land and additions on the property. | Land | Improvement |
|---|---|---|---|---|
| 2025 | $1,331 | $125,573 | $51,707 | $73,866 |
| 2024 | $1,331 | $123,112 | $50,694 | $72,418 |
| 2023 | $1,294 | $120,699 | $49,700 | $70,999 |
| 2022 | $1,236 | $118,333 | $48,726 | $69,607 |
| 2021 | $1,238 | $116,013 | $47,771 | $68,242 |
| 2020 | $1,223 | $114,823 | $47,281 | $67,542 |
| 2019 | $1,193 | $112,572 | $46,354 | $66,218 |
| 2018 | $1,158 | $110,365 | $45,445 | $64,920 |
| 2017 | $1,151 | $108,201 | $44,554 | $63,647 |
| 2016 | $1,124 | $106,079 | $43,680 | $62,399 |
| 2015 | $1,092 | $104,486 | $43,024 | $61,462 |
| 2014 | $1,092 | $102,439 | $42,181 | $60,258 |
Source: Public Records
Map
Nearby Homes
- 1009 E Harter Dr
- 941 E Harter Dr
- 2325 E Harter Dr
- 2157 Spanish Plan at Willow Springs
- 1735 Plan at Willow Springs
- 605 E Tulare Ave
- 1339 E Feemster Ave
- 909 E Seeger Ave
- 1301 S Cotta St
- 2234 S Oakhurst Ct
- 2320 S Cotta St
- 1811 S Stover St
- 1430 E Laura Ct
- 2234 S Burke St
- 2218 S Burke St
- 1818 S Cain St
- 908 S Clark St
- 904 S Bradley St
- 1812 S Bardo St
- 3838 S Court St
- 1733 S Clark St
- 1727 S Clark St
- 805 E Cambridge Ave
- 822 E Cambridge Ave
- 1818 S Thomas St
- 1834 S Thomas St
- 1734 S Clark St
- 811 E Cambridge Ave
- 1719 S Clark St
- 1720 S Michael Ct
- 1844 S Thomas St
- 825 E Cambridge Ave
- 1900 S Thomas St
- 1720 S Clark St
- 1743 S Burke St
- 1715 S Clark St
- 1735 S Burke St
- 1716 S Michael Ct
- 1721 S Michael Ct
- 1729 S Burke St