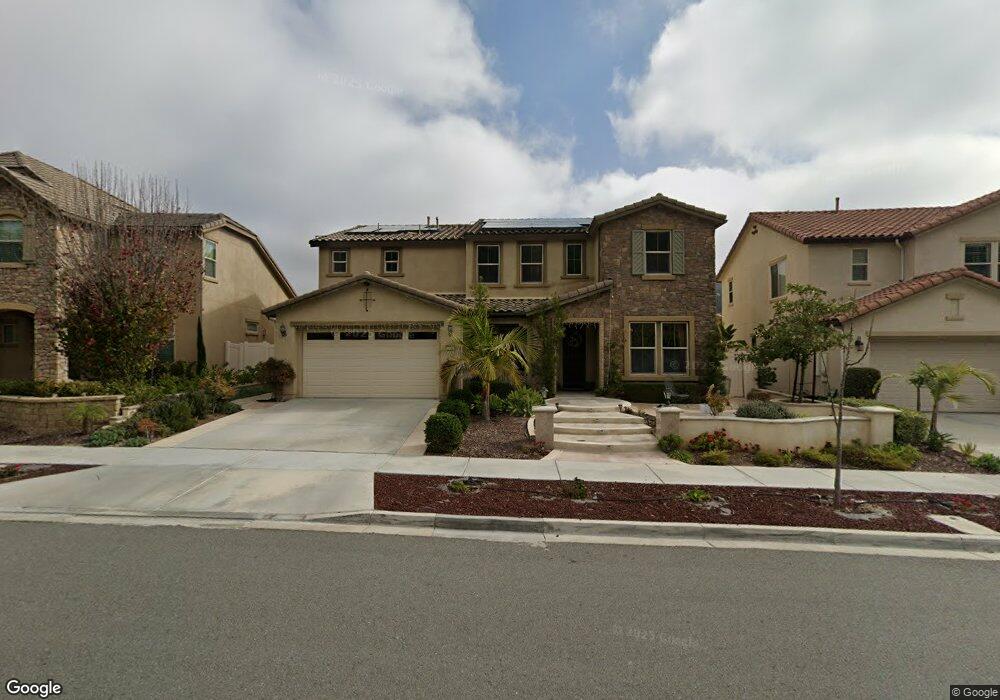
17419 Ralphs Ranch Rd San Diego, CA 92127
4S Ranch NeighborhoodEstimated Value: $2,158,600 - $2,391,000
5
Beds
4
Baths
3,262
Sq Ft
$685/Sq Ft
Est. Value
About This Home
This home is located at 17419 Ralphs Ranch Rd, San Diego, CA 92127 and is currently estimated at $2,233,150, approximately $684 per square foot. 17419 Ralphs Ranch Rd is a home located in San Diego County with nearby schools including Monterey Ridge Elementary School, Oak Valley Middle, and Del Norte High School.
Ownership History
Date
Name
Owned For
Owner Type
Purchase Details
Closed on
Dec 15, 2023
Sold by
Shrivastava Vineet and Shrivastava Smita
Bought by
Shrivastava Family Trust and Shrivastava
Current Estimated Value
Purchase Details
Closed on
Jun 28, 2011
Sold by
Pulte Home Corporation
Bought by
Shrivastava Vineet and Archana Smita
Home Financials for this Owner
Home Financials are based on the most recent Mortgage that was taken out on this home.
Original Mortgage
$559,904
Interest Rate
4.46%
Mortgage Type
New Conventional
Purchase Details
Closed on
Dec 15, 2010
Sold by
4S Kelwood General Partnership
Bought by
Pulte Home Corporation
Create a Home Valuation Report for This Property
The Home Valuation Report is an in-depth analysis detailing your home's value as well as a comparison with similar homes in the area
Home Values in the Area
Average Home Value in this Area
Purchase History
| Date | Buyer | Sale Price | Title Company |
|---|---|---|---|
| Shrivastava Family Trust | -- | None Listed On Document | |
| Shrivastava Vineet | $700,000 | First American Title Company | |
| Pulte Home Corporation | $10,394,500 | Chicago Title Company Subdiv |
Source: Public Records
Mortgage History
| Date | Status | Borrower | Loan Amount |
|---|---|---|---|
| Previous Owner | Shrivastava Vineet | $559,904 |
Source: Public Records
Tax History Compared to Growth
Tax History
| Year | Tax Paid | Tax Assessment Tax Assessment Total Assessment is a certain percentage of the fair market value that is determined by local assessors to be the total taxable value of land and additions on the property. | Land | Improvement |
|---|---|---|---|---|
| 2025 | $12,512 | $879,076 | $376,811 | $502,265 |
| 2024 | $12,512 | $861,840 | $369,423 | $492,417 |
| 2023 | $12,051 | $844,942 | $362,180 | $482,762 |
| 2022 | $12,438 | $828,376 | $355,079 | $473,297 |
| 2021 | $12,115 | $812,134 | $348,117 | $464,017 |
| 2020 | $11,871 | $803,808 | $344,548 | $459,260 |
| 2019 | $11,449 | $788,048 | $337,793 | $450,255 |
| 2018 | $11,395 | $772,597 | $331,170 | $441,427 |
| 2017 | $11,011 | $757,449 | $324,677 | $432,772 |
| 2016 | $10,712 | $742,598 | $318,311 | $424,287 |
| 2015 | $10,525 | $731,444 | $313,530 | $417,914 |
| 2014 | $10,295 | $717,117 | $307,389 | $409,728 |
Source: Public Records
Map
Nearby Homes
- 10545 Richard Rd
- 17595 Alva Rd
- 10214 Sienna Hills Dr
- 17155 Albert Ave
- 10237 Paseo de Linda
- 10518 Monterey Ridge Dr
- 10511 Monterey Ridge Dr
- 17134 Monterey Ridge Way
- 10409 Cherry Blossom Ln
- 16959 Silver Crest Dr
- 17022 Calle Trevino Unit 13
- 17071 Calle Trevino Unit 8
- 10551 Sanshey Ln Unit 132
- 17161 Alva Rd Unit 3023
- 17161 Alva Rd Unit 3125
- 17161 Alva Rd Unit 1523
- 17161 Alva Rd Unit 2512
- 17161 Alva Rd Unit 1214
- 17161 Alva Rd Unit 221
- 9343 Bernardo Lakes Dr
- 17411 Ralphs Ranch Rd
- 17427 Ralphs Ranch Rd
- 17414 Teal Stone Ct
- 17435 Ralphs Ranch Rd
- 17430 Teal Stone Ct
- 10408 Richard Rd
- 10416 Richard Rd
- 17407 Teal Stone Ct
- 10424 Richard Rd
- 17428 Ralphs Ranch Rd
- 10432 Richard Rd
- 17436 Ralphs Ranch Rd
- 10440 Richard Rd
- 17415 Teal Stone Ct
- 17423 Teal Stone Ct
- 17451 Ralphs Ranch Rd
- 17431 Teal Stone Ct
- 10448 Richard Rd
- 17444 Ralphs Ranch Rd
- 17506 Teal Stone Ct