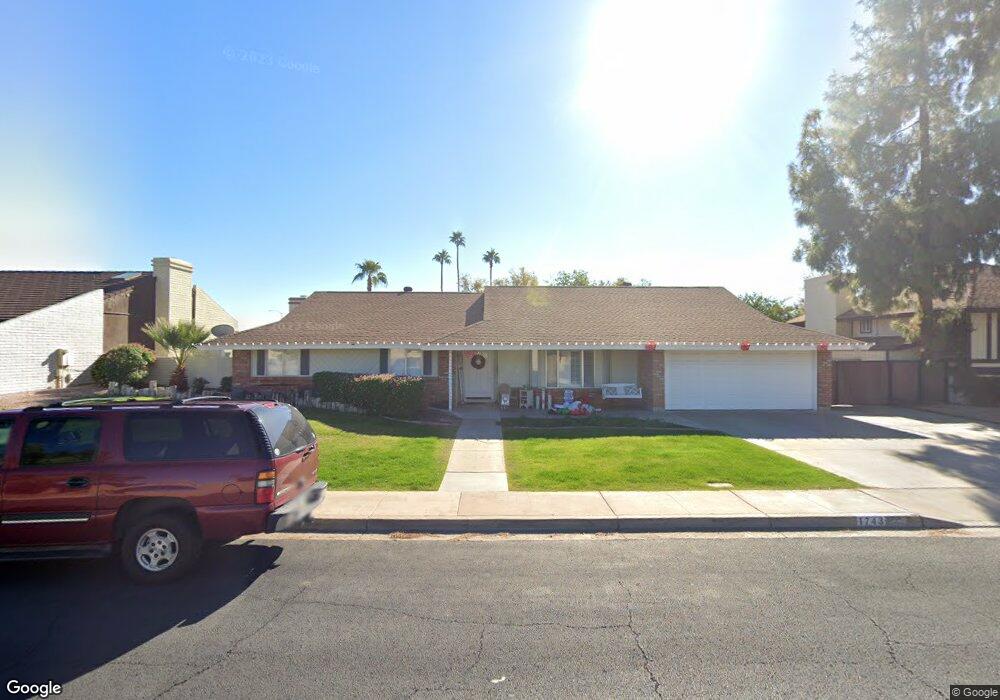
1743 E Gable Ave Mesa, AZ 85204
Woodbridge Crossing NeighborhoodEstimated Value: $556,438 - $605,000
5
Beds
3
Baths
2,896
Sq Ft
$200/Sq Ft
Est. Value
About This Home
This home is located at 1743 E Gable Ave, Mesa, AZ 85204 and is currently estimated at $579,860, approximately $200 per square foot. 1743 E Gable Ave is a home located in Maricopa County with nearby schools including Keller Elementary School, Franklin at Brimhall Elementary School, and Franklin West Elementary School.
Ownership History
Date
Name
Owned For
Owner Type
Purchase Details
Closed on
Mar 4, 2018
Sold by
Shirts John A and Shirts Melynda B
Bought by
Shirts John A and Shirts Melynda B
Current Estimated Value
Purchase Details
Closed on
Sep 29, 2016
Sold by
Mclaws Michael C and Mclaws Diana K
Bought by
Shirts John A and Shirts Melynda B
Home Financials for this Owner
Home Financials are based on the most recent Mortgage that was taken out on this home.
Original Mortgage
$238,400
Outstanding Balance
$191,122
Interest Rate
3.46%
Mortgage Type
New Conventional
Estimated Equity
$388,738
Purchase Details
Closed on
Dec 20, 1994
Sold by
Glaser Ronald S and Glaser Donna
Bought by
Mclaws Michael C and Mclaws Diana K
Home Financials for this Owner
Home Financials are based on the most recent Mortgage that was taken out on this home.
Original Mortgage
$108,000
Interest Rate
5.5%
Mortgage Type
New Conventional
Create a Home Valuation Report for This Property
The Home Valuation Report is an in-depth analysis detailing your home's value as well as a comparison with similar homes in the area
Home Values in the Area
Average Home Value in this Area
Purchase History
| Date | Buyer | Sale Price | Title Company |
|---|---|---|---|
| Shirts John A | -- | None Available | |
| Shirts John A | $298,000 | Security Title Agency Inc | |
| Mclaws Michael C | $124,150 | Transamerica Title Ins Co |
Source: Public Records
Mortgage History
| Date | Status | Borrower | Loan Amount |
|---|---|---|---|
| Open | Shirts John A | $238,400 | |
| Previous Owner | Mclaws Michael C | $108,000 |
Source: Public Records
Tax History
| Year | Tax Paid | Tax Assessment Tax Assessment Total Assessment is a certain percentage of the fair market value that is determined by local assessors to be the total taxable value of land and additions on the property. | Land | Improvement |
|---|---|---|---|---|
| 2025 | $1,793 | $21,589 | -- | -- |
| 2024 | $1,812 | $20,561 | -- | -- |
| 2023 | $1,812 | $38,380 | $7,670 | $30,710 |
| 2022 | $1,773 | $33,920 | $6,780 | $27,140 |
| 2021 | $1,821 | $32,480 | $6,490 | $25,990 |
| 2020 | $1,797 | $29,950 | $5,990 | $23,960 |
| 2019 | $1,665 | $27,950 | $5,590 | $22,360 |
| 2018 | $1,589 | $26,070 | $5,210 | $20,860 |
| 2017 | $1,539 | $24,030 | $4,800 | $19,230 |
| 2016 | $1,512 | $22,610 | $4,520 | $18,090 |
| 2015 | $1,427 | $21,070 | $4,210 | $16,860 |
Source: Public Records
Map
Nearby Homes
- 1713 E Gable Ave
- 1301 S Hall
- 1626 E Garnet Ave
- 1756 E Harmony Ave
- 1534 E Hampton Cir
- 1551 E Florian Cir
- 1927 E Hampton Ave Unit 207
- 1927 E Hampton Ave Unit 258
- 1927 E Hampton Ave Unit 212
- 1308 South Spur
- 1832 E Enid Ave
- 1341 E Garnet Cir
- 1030 South Spur
- 1743 E Irwin Ave
- 2219 E Fairview Ave
- 1525 S Chestnut Cir
- 1643 E Impala Ave
- 1753 E Diamond Ave
- 714 S Williams
- 1521 E Diamond Ave
- 1733 E Gable Ave
- 1746 E Garnet Ave
- 1756 E Garnet Ave
- 1736 E Garnet Ave
- 1215 S Williams Cir
- 1723 E Gable Ave
- 1726 E Garnet Ave
- 1216 S Williams Cir
- 1233 S Hall
- 1241 S Hall
- 1210 S Hall
- 1225 S Hall
- 1207 S Williams Cir
- 1747 E Garnet Ave
- 1251 S Hall
- 1737 E Garnet Ave
- 1757 E Garnet Ave
- 1716 E Garnet Ave
- 1217 S Hall
- 1727 E Garnet Ave
Your Personal Tour Guide
Ask me questions while you tour the home.