1743 Higley Ave SE Cedar Rapids, IA 52403
Wellington Heights NeighborhoodEstimated Value: $54,000 - $107,824
3
Beds
1
Bath
904
Sq Ft
$98/Sq Ft
Est. Value
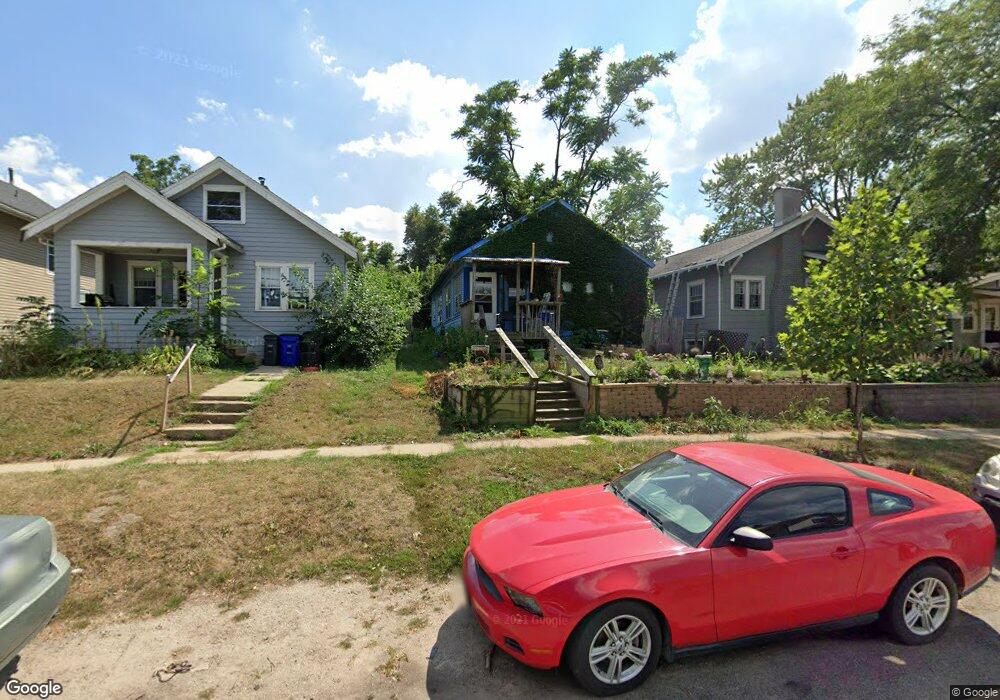
About This Home
This home is located at 1743 Higley Ave SE, Cedar Rapids, IA 52403 and is currently estimated at $88,941, approximately $98 per square foot. 1743 Higley Ave SE is a home located in Linn County with nearby schools including Grant Wood Elementary School, Summit Elementary School, and McKinley STEAM Academy.
Ownership History
Date
Name
Owned For
Owner Type
Purchase Details
Closed on
Nov 27, 2020
Sold by
Rapids Bank And Trust Company
Bought by
Thornton Robert and Thornton Dixie
Current Estimated Value
Purchase Details
Closed on
Oct 9, 2007
Sold by
Contract Exchange Corp
Bought by
Ira Patricia R Schubert and Guaranty Bank & Trust Co
Purchase Details
Closed on
Sep 18, 2007
Sold by
Ira Ginger Pruess
Bought by
Contract Exchange Corp
Purchase Details
Closed on
Jan 10, 2006
Sold by
Contract Exchange Corp
Bought by
Ira Ginger Pruess and Guaranty Bank & Trust Co
Purchase Details
Closed on
Nov 22, 2005
Sold by
Howard Kathleen F
Bought by
Contract Exchange Corp
Purchase Details
Closed on
Jun 5, 1996
Sold by
Howard Kathleen F
Bought by
Thornton Robert and Thornton Dixie
Home Financials for this Owner
Home Financials are based on the most recent Mortgage that was taken out on this home.
Original Mortgage
$35,000
Interest Rate
7.07%
Mortgage Type
Purchase Money Mortgage
Create a Home Valuation Report for This Property
The Home Valuation Report is an in-depth analysis detailing your home's value as well as a comparison with similar homes in the area
Home Values in the Area
Average Home Value in this Area
Purchase History
| Date | Buyer | Sale Price | Title Company |
|---|---|---|---|
| Thornton Robert | $35,000 | None Available | |
| Ira Patricia R Schubert | -- | None Available | |
| Contract Exchange Corp | -- | None Available | |
| Ira Ginger Pruess | -- | None Available | |
| Contract Exchange Corp | -- | -- | |
| Thornton Robert | $35,000 | -- |
Source: Public Records
Mortgage History
| Date | Status | Borrower | Loan Amount |
|---|---|---|---|
| Previous Owner | Thornton Robert | $35,000 |
Source: Public Records
Tax History Compared to Growth
Tax History
| Year | Tax Paid | Tax Assessment Tax Assessment Total Assessment is a certain percentage of the fair market value that is determined by local assessors to be the total taxable value of land and additions on the property. | Land | Improvement |
|---|---|---|---|---|
| 2025 | $916 | $68,500 | $24,900 | $43,600 |
| 2024 | $938 | $62,200 | $22,000 | $40,200 |
| 2023 | $938 | $62,200 | $22,000 | $40,200 |
| 2022 | $796 | $53,300 | $20,100 | $33,200 |
| 2021 | $936 | $47,400 | $17,200 | $30,200 |
| 2020 | $936 | $51,000 | $15,300 | $35,700 |
| 2019 | $704 | $49,100 | $13,400 | $35,700 |
| 2018 | $680 | $41,200 | $13,400 | $27,800 |
| 2017 | $859 | $41,300 | $13,400 | $27,900 |
| 2016 | $859 | $40,400 | $13,400 | $27,000 |
| 2015 | $1,087 | $51,074 | $13,388 | $37,686 |
| 2014 | $902 | $51,074 | $13,388 | $37,686 |
| 2013 | $878 | $51,074 | $13,388 | $37,686 |
Source: Public Records
Map
Nearby Homes
- 826 Wellington St SE
- 1828 Mount Vernon Rd SE
- 809 17th St SE
- 1713 7th Ave SE
- 1946 Higley Ave SE
- 1041 19th St SE
- 1911 Ridgeway Dr SE
- 1721 Americus Dr SE
- 1815 5th Ave SE
- 1506 8th Ave SE
- 513 17th St SE
- 1618 13th Ave SE
- 1052 20th St SE
- 414 18th St SE
- 421 17th St SE
- 1522 6th Ave SE
- 1929 Ridgeway Dr SE
- 1741 4th Ave SE
- 549 Vernon Dr SE
- 1512 6th Ave SE
- 1741 Higley Ave SE
- 1745 Higley Ave SE
- 857 18th St SE
- 1733 Higley Ave SE
- 1751 Higley Avenue South Ea St
- 1751 Higley Ave SE
- 1731 Higley Ave SE
- 865 18th St SE
- 869 18th St SE
- 1742 Mount Vernon Rd SE
- 1738 Mount Vernon Rd SE
- 1801 Higley Ave SE
- 1738 Higley Ave SE
- 1734 Mount Vernon Rd SE
- 1734 Higley Ave SE
- 1748 Higley Ave SE
- 858 18th St SE
- 862 18th St SE
- 1744 Mount Vernon Rd SE
- 1805 Higley Ave SE