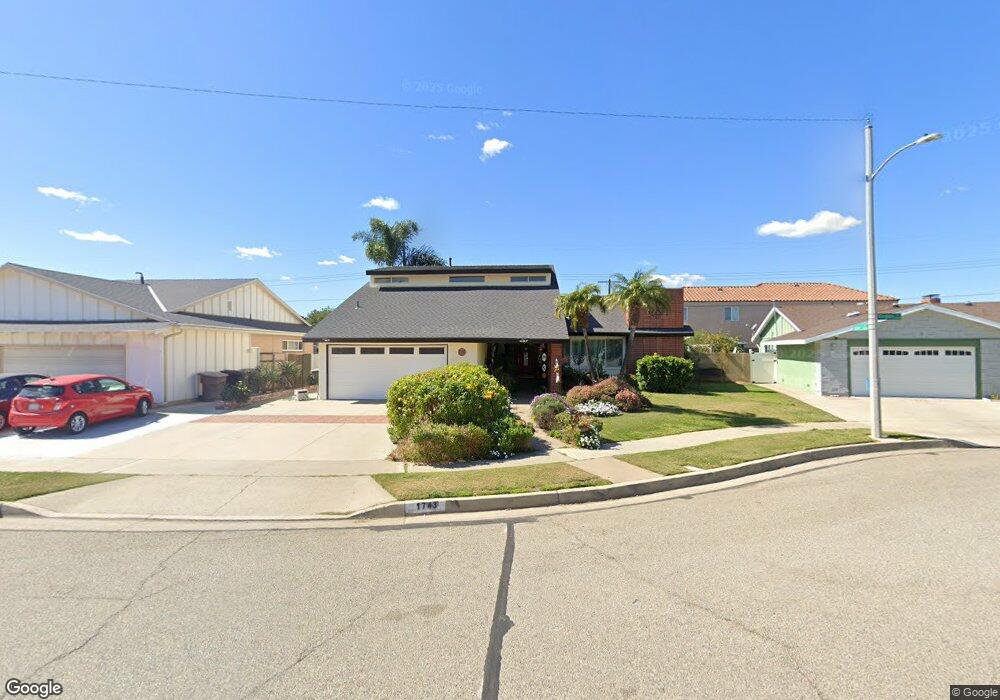
1743 Virginia Place Placentia, CA 92870
Estimated Value: $1,153,964 - $1,258,000
5
Beds
2
Baths
2,200
Sq Ft
$544/Sq Ft
Est. Value
About This Home
This home is located at 1743 Virginia Place, Placentia, CA 92870 and is currently estimated at $1,195,741, approximately $543 per square foot. 1743 Virginia Place is a home located in Orange County with nearby schools including Sierra Vista Elementary School, Col. J. K. Tuffree Middle School, and El Dorado High School.
Ownership History
Date
Name
Owned For
Owner Type
Purchase Details
Closed on
Jan 31, 2000
Sold by
Barrios Carlos M
Bought by
Barrios Carlos and Gasbarri Denise
Current Estimated Value
Home Financials for this Owner
Home Financials are based on the most recent Mortgage that was taken out on this home.
Original Mortgage
$185,000
Outstanding Balance
$61,603
Interest Rate
8.26%
Estimated Equity
$1,134,138
Purchase Details
Closed on
Nov 19, 1999
Sold by
Strickland Norman O
Bought by
Strickland Norman O
Home Financials for this Owner
Home Financials are based on the most recent Mortgage that was taken out on this home.
Original Mortgage
$221,250
Interest Rate
7.84%
Purchase Details
Closed on
Jul 8, 1998
Sold by
Strickland Norman O and Strickland Margaret
Bought by
Strickland Norman O and Strickland Margaret
Create a Home Valuation Report for This Property
The Home Valuation Report is an in-depth analysis detailing your home's value as well as a comparison with similar homes in the area
Home Values in the Area
Average Home Value in this Area
Purchase History
| Date | Buyer | Sale Price | Title Company |
|---|---|---|---|
| Barrios Carlos | -- | -- | |
| Barrios Carlos M | $285,000 | Orange Coast Title | |
| Strickland Norman O | -- | Orange Coast Title | |
| Strickland Norman O | -- | -- |
Source: Public Records
Mortgage History
| Date | Status | Borrower | Loan Amount |
|---|---|---|---|
| Open | Barrios Carlos M | $185,000 | |
| Previous Owner | Strickland Norman O | $221,250 |
Source: Public Records
Tax History Compared to Growth
Tax History
| Year | Tax Paid | Tax Assessment Tax Assessment Total Assessment is a certain percentage of the fair market value that is determined by local assessors to be the total taxable value of land and additions on the property. | Land | Improvement |
|---|---|---|---|---|
| 2025 | $5,357 | $438,029 | $267,591 | $170,438 |
| 2024 | $5,357 | $429,441 | $262,344 | $167,097 |
| 2023 | $5,234 | $421,021 | $257,200 | $163,821 |
| 2022 | $5,142 | $412,766 | $252,157 | $160,609 |
| 2021 | $5,006 | $404,673 | $247,213 | $157,460 |
| 2020 | $5,020 | $400,524 | $244,678 | $155,846 |
| 2019 | $4,815 | $392,671 | $239,880 | $152,791 |
| 2018 | $4,751 | $384,972 | $235,176 | $149,796 |
| 2017 | $4,668 | $377,424 | $230,565 | $146,859 |
| 2016 | $4,574 | $370,024 | $226,044 | $143,980 |
| 2015 | $4,513 | $364,466 | $222,648 | $141,818 |
| 2014 | $4,386 | $357,327 | $218,287 | $139,040 |
Source: Public Records
Map
Nearby Homes
- 1717 Saint James Place
- 1707 Stanley Ave
- 1726 Stanley Ave
- 3110 E Palm Dr Unit 14
- 2454 Beacon St
- 1925 Frederick St
- 2885 Winchester St
- 3043 Topaz Ln
- 3049 Topaz Ln
- 3037 Garnet Ln
- 1525 Welldow Ln Unit 149
- 3100 Garnet Ln
- 2625 Andover Ave
- 2946 Pembroke Ct
- 3117 Pearl Dr
- 3225 Topaz Ln
- 3124 Pearl Dr
- 2878 Treeview Place
- 2014 Associated Rd Unit 2
- 3116 Quartz Ln
- 1737 Virginia Place
- 601 Lori Way
- 1749 Virginia Place
- 602 Joan Way
- 1731 Virginia Place
- 543 Lee Place
- 607 Lori Way
- 1740 Virginia Place
- 608 Joan Way
- 537 Lee Place
- 1734 Virginia Place
- 602 Lori Way
- 1725 Virginia Place
- 531 Lee Place
- 608 Lori Way
- 614 Joan Way
- 1728 Virginia Place
- 601 Joan Way
- 1741 Saint James Place
- 1735 Saint James Place