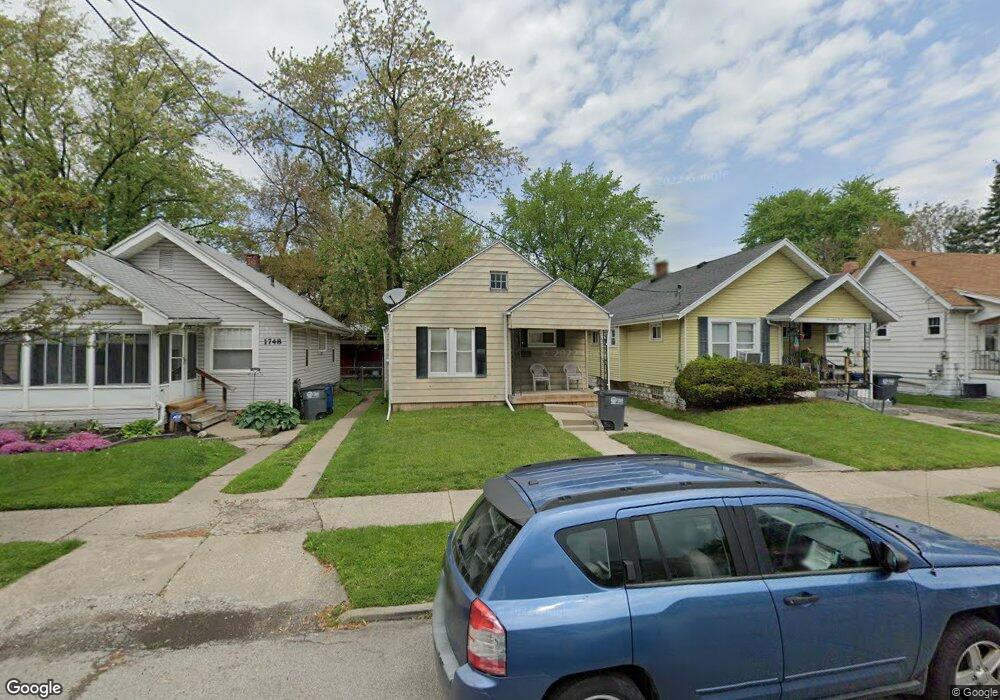
1744 Marlow Rd Toledo, OH 43613
DeVeaux NeighborhoodEstimated Value: $64,000 - $83,000
2
Beds
1
Bath
1,146
Sq Ft
$66/Sq Ft
Est. Value
About This Home
This home is located at 1744 Marlow Rd, Toledo, OH 43613 and is currently estimated at $75,252, approximately $65 per square foot. 1744 Marlow Rd is a home located in Lucas County with nearby schools including McKinley Stemm Academy, Start High School, and Hope Learning Academy of Toledo.
Ownership History
Date
Name
Owned For
Owner Type
Purchase Details
Closed on
Feb 27, 2004
Sold by
R J Smith Homes Inc
Bought by
Haney Kathleen M
Current Estimated Value
Home Financials for this Owner
Home Financials are based on the most recent Mortgage that was taken out on this home.
Original Mortgage
$64,500
Outstanding Balance
$28,447
Interest Rate
4.87%
Mortgage Type
Purchase Money Mortgage
Estimated Equity
$46,805
Purchase Details
Closed on
Nov 7, 2002
Sold by
Household Realty Corp
Bought by
R J Smith Homes Inc
Purchase Details
Closed on
Aug 9, 2002
Sold by
Clorinda Harris
Bought by
Household Realty Corp
Purchase Details
Closed on
Jul 2, 1998
Sold by
Simonds Philip G
Bought by
Harris Clorinda
Home Financials for this Owner
Home Financials are based on the most recent Mortgage that was taken out on this home.
Original Mortgage
$52,550
Interest Rate
11.35%
Purchase Details
Closed on
Dec 14, 1993
Sold by
Ulmer John F
Create a Home Valuation Report for This Property
The Home Valuation Report is an in-depth analysis detailing your home's value as well as a comparison with similar homes in the area
Home Values in the Area
Average Home Value in this Area
Purchase History
| Date | Buyer | Sale Price | Title Company |
|---|---|---|---|
| Haney Kathleen M | $64,500 | Multiple | |
| R J Smith Homes Inc | $35,000 | Metro Title Agency Inc | |
| Household Realty Corp | $40,000 | Metro Title Agency Inc | |
| Harris Clorinda | $56,800 | First Ohio Title Services In | |
| -- | -- | -- |
Source: Public Records
Mortgage History
| Date | Status | Borrower | Loan Amount |
|---|---|---|---|
| Open | Haney Kathleen M | $64,500 | |
| Previous Owner | Harris Clorinda | $52,550 |
Source: Public Records
Tax History Compared to Growth
Tax History
| Year | Tax Paid | Tax Assessment Tax Assessment Total Assessment is a certain percentage of the fair market value that is determined by local assessors to be the total taxable value of land and additions on the property. | Land | Improvement |
|---|---|---|---|---|
| 2024 | $544 | $17,360 | $6,860 | $10,500 |
| 2023 | $1,081 | $16,590 | $3,675 | $12,915 |
| 2022 | $1,085 | $16,590 | $3,675 | $12,915 |
| 2021 | $1,111 | $16,590 | $3,675 | $12,915 |
| 2020 | $1,208 | $16,065 | $3,535 | $12,530 |
| 2019 | $1,175 | $16,065 | $3,535 | $12,530 |
| 2018 | $1,190 | $16,065 | $3,535 | $12,530 |
| 2017 | $1,210 | $15,715 | $3,465 | $12,250 |
| 2016 | $1,210 | $44,900 | $9,900 | $35,000 |
| 2015 | $1,199 | $44,900 | $9,900 | $35,000 |
| 2014 | $989 | $15,720 | $3,470 | $12,250 |
| 2013 | $989 | $15,720 | $3,470 | $12,250 |
Source: Public Records
Map
Nearby Homes
- 1759 Talbot St
- 1822 Wychwood St
- 3430 Upton Ave
- 1735 Wychwood St
- 1840 Talbot St
- 1747 Duncan Rd
- 1814 Balkan Place
- 1929 Marlow Rd
- 1749 Berdan Ave
- 1815 Berdan Ave
- 1820 Marne Ave
- 1846 Balkan Place
- 1935 Talbot St
- 1952 Fairfax Rd
- 1834 Berdan Ave
- 1741 Barrows St
- 1939 Balkan Place
- 3821 Jackman Rd
- 1751 Georgia Ave
- 1818 Barrows St
- 1748 Marlow Rd
- 1736 Marlow Rd
- 1752 Marlow Rd
- 1734 Marlow Rd
- 1756 Marlow Rd
- 1745 Mansfield Rd
- 1747 Mansfield Rd
- 1743 Mansfield Rd
- 1749 Mansfield Rd
- 1731 Mansfield Rd
- 1732 Marlow Rd
- 1751 Mansfield Rd
- 1758 Marlow Rd
- 1729 Mansfield Rd
- 1747 Marlow Rd
- 1753 Mansfield Rd
- 1741 Marlow Rd
- 1751 Marlow Rd
- 1739 Marlow Rd
- 1727 Mansfield Rd