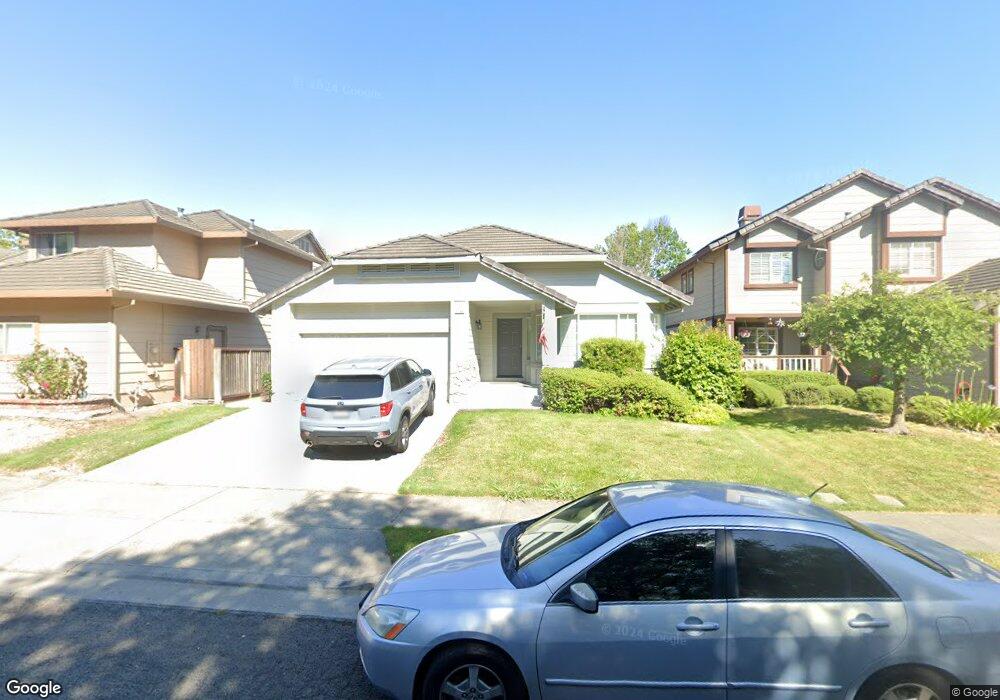
1744 Spyglass Rd Petaluma, CA 94954
Adobe NeighborhoodEstimated Value: $839,000 - $948,000
3
Beds
2
Baths
1,749
Sq Ft
$510/Sq Ft
Est. Value
About This Home
This home is located at 1744 Spyglass Rd, Petaluma, CA 94954 and is currently estimated at $891,177, approximately $509 per square foot. 1744 Spyglass Rd is a home located in Sonoma County with nearby schools including Kenilworth Junior High School, Casa Grande High School, and Miwok Valley Elementary Charter School.
Ownership History
Date
Name
Owned For
Owner Type
Purchase Details
Closed on
Aug 4, 2020
Sold by
Pacciorini Rosalind
Bought by
Pacciorini Rosalind E and The Rosalind E Pacciorini Trus
Current Estimated Value
Purchase Details
Closed on
Jun 2, 2020
Sold by
Pacciorini Jeffrey
Bought by
Pacciorini Jeffrey T and The Jeffrey T Pacciorini Trust
Purchase Details
Closed on
Oct 8, 2018
Sold by
Pacciorini James H
Bought by
Pacciorini James H and The James H Pacciorini Revocab
Purchase Details
Closed on
Jun 9, 2017
Sold by
Pacciorini Janis
Bought by
Pacciorini Rosalind and Pacciorini James H
Purchase Details
Closed on
Dec 7, 2015
Sold by
Pacciorini Janis and Pacciorini James H
Bought by
Pacciorini Janis and Pacciorini Rosalind
Purchase Details
Closed on
Apr 10, 2007
Sold by
Pacciorini Lillian and The Pacciorini Family Living T
Bought by
Pacciorini Lillian and The Pacciorini Family Living T
Purchase Details
Closed on
Jun 16, 1993
Bought by
Pacciorini Janis
Create a Home Valuation Report for This Property
The Home Valuation Report is an in-depth analysis detailing your home's value as well as a comparison with similar homes in the area
Home Values in the Area
Average Home Value in this Area
Purchase History
| Date | Buyer | Sale Price | Title Company |
|---|---|---|---|
| Pacciorini Rosalind E | -- | None Available | |
| Pacciorini Jeffrey T | -- | None Available | |
| Pacciorini James H | -- | None Available | |
| Pacciorini Rosalind | $530,000 | Fidelity National Title Co | |
| Pacciorini Janis | -- | None Available | |
| Pacciorini Lillian | -- | None Available | |
| Pacciorini Janis | $225,000 | -- |
Source: Public Records
Tax History Compared to Growth
Tax History
| Year | Tax Paid | Tax Assessment Tax Assessment Total Assessment is a certain percentage of the fair market value that is determined by local assessors to be the total taxable value of land and additions on the property. | Land | Improvement |
|---|---|---|---|---|
| 2025 | $7,061 | $624,162 | $243,357 | $380,805 |
| 2024 | $7,061 | $611,925 | $238,586 | $373,339 |
| 2023 | $7,061 | $599,927 | $233,908 | $366,019 |
| 2022 | $6,895 | $588,165 | $229,322 | $358,843 |
| 2021 | $6,814 | $576,633 | $224,826 | $351,807 |
| 2020 | $6,709 | $570,721 | $222,521 | $348,200 |
| 2019 | $6,625 | $559,531 | $218,158 | $341,373 |
| 2018 | $6,597 | $548,561 | $213,881 | $334,680 |
| 2017 | $5,580 | $460,066 | $174,297 | $285,769 |
| 2016 | $5,452 | $451,046 | $170,880 | $280,166 |
| 2015 | $3,578 | $303,544 | $101,629 | $201,915 |
| 2014 | $3,635 | $297,599 | $99,639 | $197,960 |
Source: Public Records
Map
Nearby Homes
- 12 Birnam Wood Ct
- 2 Wedgewood Ct
- 2014 Crinella Dr
- 1917 Falcon Ridge Dr
- 4 Starling Dr
- 1878 Adobe Creek Dr
- 1727 Chinar Dr
- 1694 Southridge Dr
- 1180 Wieling Way
- 1103 Marylyn Cir
- 1052 Helen Ct
- 2189 Saint Augustine Cir
- 602 Marylyn Cir
- 601 Marylyn Cir Unit 21
- 1513 Elizabeth Dr
- 1302 Marylyn Cir
- 1120 S Mcdowell Blvd
- 1711 Capistrano Dr
- 827 Grouse Ln
- 724 Garfield Dr
- 1740 Spyglass Rd
- 1748 Spyglass Rd
- 1736 Spyglass Rd
- 1767 Silverado Cir
- 1752 Spyglass Rd
- 1737 Silverado Cir
- 1733 Silverado Cir
- 1763 Silverado Cir
- 1729 Silverado Cir
- 1703 Silverado Cir
- 1741 Silverado Cir
- 1707 Silverado Cir
- 1747 Spyglass Rd
- 1770 Silverado Cir
- 1755 Spyglass Rd
- 1702 Silverado Cir
- 1766 Silverado Cir
- 1734 Silverado Cir
- 1738 Silverado Cir
- 1730 Silverado Cir