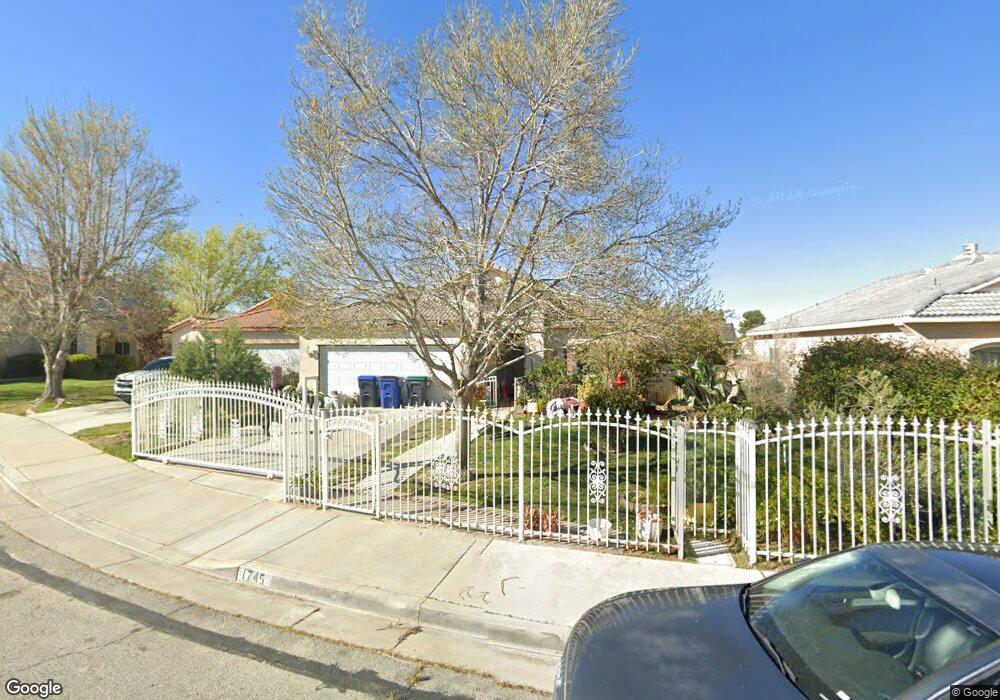
1745 Pinecone Ct Lancaster, CA 93535
East Lancaster NeighborhoodEstimated Value: $426,172 - $463,000
4
Beds
2
Baths
1,421
Sq Ft
$308/Sq Ft
Est. Value
About This Home
This home is located at 1745 Pinecone Ct, Lancaster, CA 93535 and is currently estimated at $437,543, approximately $307 per square foot. 1745 Pinecone Ct is a home located in Los Angeles County with nearby schools including Lincoln Elementary School, New Vista Middle School, and Eastside High School.
Ownership History
Date
Name
Owned For
Owner Type
Purchase Details
Closed on
Mar 24, 2005
Sold by
Marks Eurimica Martisha
Bought by
Osling Morrell Alexander and Osling Eurimica Martisha Marks
Current Estimated Value
Purchase Details
Closed on
Aug 18, 2003
Sold by
Regency Hills Homes Llc
Bought by
Marks Eurimica Martisha
Home Financials for this Owner
Home Financials are based on the most recent Mortgage that was taken out on this home.
Original Mortgage
$162,587
Interest Rate
6.4%
Mortgage Type
FHA
Purchase Details
Closed on
Dec 5, 2002
Sold by
Weiss David and Kasirer Jacob
Bought by
Regency Hills Homes Llc
Home Financials for this Owner
Home Financials are based on the most recent Mortgage that was taken out on this home.
Original Mortgage
$3,539,000
Interest Rate
6.06%
Mortgage Type
Construction
Create a Home Valuation Report for This Property
The Home Valuation Report is an in-depth analysis detailing your home's value as well as a comparison with similar homes in the area
Home Values in the Area
Average Home Value in this Area
Purchase History
| Date | Buyer | Sale Price | Title Company |
|---|---|---|---|
| Osling Morrell Alexander | -- | -- | |
| Marks Eurimica Martisha | $165,500 | First American Title Co | |
| Regency Hills Homes Llc | -- | First American Title Co |
Source: Public Records
Mortgage History
| Date | Status | Borrower | Loan Amount |
|---|---|---|---|
| Previous Owner | Marks Eurimica Martisha | $162,587 | |
| Previous Owner | Regency Hills Homes Llc | $3,539,000 | |
| Closed | Marks Eurimica Martisha | $4,954 |
Source: Public Records
Tax History
| Year | Tax Paid | Tax Assessment Tax Assessment Total Assessment is a certain percentage of the fair market value that is determined by local assessors to be the total taxable value of land and additions on the property. | Land | Improvement |
|---|---|---|---|---|
| 2025 | $4,171 | $234,717 | $48,614 | $186,103 |
| 2024 | $4,171 | $230,115 | $47,661 | $182,454 |
| 2023 | $4,087 | $225,604 | $46,727 | $178,877 |
| 2022 | $3,986 | $221,181 | $45,811 | $175,370 |
| 2021 | $3,591 | $216,845 | $44,913 | $171,932 |
| 2020 | $3,552 | $214,623 | $44,453 | $170,170 |
| 2019 | $3,493 | $210,416 | $43,582 | $166,834 |
| 2018 | $3,383 | $206,291 | $42,728 | $163,563 |
| 2016 | $3,022 | $182,200 | $37,600 | $144,600 |
| 2015 | $2,851 | $168,000 | $34,700 | $133,300 |
| 2014 | $2,664 | $150,000 | $31,000 | $119,000 |
Source: Public Records
Map
Nearby Homes
- 44053 Canyon Way
- 1768 E Mesa Dr
- 1768 Mesa Dr
- 1806 E Mesa Dr
- 1853 Horizon Ln
- 43929 Amy Ct
- 1840 E Avenue j2 Unit 5
- 44103 Sundance Ct
- 1836 E Avenue j2 Unit 5
- 1820 E Avenue J 10
- 1844 E Avenue j2 Unit 4
- 110 E Avenue j6 Unit Vic
- 101 E Avenue j6
- 43964 Fallon Dr
- 44256 Sunmist Ct
- 43922 Fallon Dr
- 1517 E Avenue j6
- 43850 20th St E Unit 83
- 43850 20th St E Unit 265
- 43850 20th St E Unit Spc 114
- 1751 Pinecone Ct
- 1739 Pinecone Ct
- 1735 Pinecone Ct
- 44107 Greentree Ct
- 44027 Parkview Ln
- 44035 Parkview Ln
- 44115 Greentree Ct
- 1744 Pinecone Ct
- 1750 Pinecone Ct
- 1738 Pinecone Ct
- 44041 Parkview Ln
- 44048 Sunview Ct
- 44054 Sunview Ct
- 1734 Pinecone Ct
- 44015 Parkview Ln
- 44042 Sunview Ct
- 44119 Greentree Ct
- 44060 Sunview Ct
- 44036 Sunview Ct
- 44047 Parkview Ln
Your Personal Tour Guide
Ask me questions while you tour the home.