1746 Tipton Springs Rd Morganton, GA 30560
Estimated Value: $593,886 - $822,000
--
Bed
--
Bath
1,926
Sq Ft
$385/Sq Ft
Est. Value
About This Home
This home is located at 1746 Tipton Springs Rd, Morganton, GA 30560 and is currently estimated at $741,962, approximately $385 per square foot. 1746 Tipton Springs Rd is a home with nearby schools including Fannin County High School.
Ownership History
Date
Name
Owned For
Owner Type
Purchase Details
Closed on
Mar 9, 1990
Bought by
Zelley Richard S and Zelley T
Current Estimated Value
Create a Home Valuation Report for This Property
The Home Valuation Report is an in-depth analysis detailing your home's value as well as a comparison with similar homes in the area
Home Values in the Area
Average Home Value in this Area
Purchase History
| Date | Buyer | Sale Price | Title Company |
|---|---|---|---|
| Zelley Richard S | -- | -- |
Source: Public Records
Tax History Compared to Growth
Tax History
| Year | Tax Paid | Tax Assessment Tax Assessment Total Assessment is a certain percentage of the fair market value that is determined by local assessors to be the total taxable value of land and additions on the property. | Land | Improvement |
|---|---|---|---|---|
| 2024 | $1,340 | $237,170 | $46,432 | $190,738 |
| 2023 | $1,385 | $200,378 | $46,432 | $153,946 |
| 2022 | $1,390 | $202,603 | $46,432 | $156,171 |
| 2021 | $1,633 | $145,684 | $46,432 | $99,252 |
| 2020 | $1,658 | $145,684 | $46,432 | $99,252 |
| 2019 | $1,691 | $145,684 | $46,432 | $99,252 |
| 2018 | $1,609 | $121,050 | $21,798 | $99,252 |
| 2017 | $2,165 | $122,374 | $21,798 | $100,576 |
| 2016 | $1,448 | $108,192 | $21,798 | $86,394 |
| 2015 | $1,550 | $110,525 | $21,798 | $88,727 |
| 2014 | $1,877 | $129,242 | $23,226 | $106,016 |
| 2013 | -- | $65,102 | $25,038 | $40,064 |
Source: Public Records
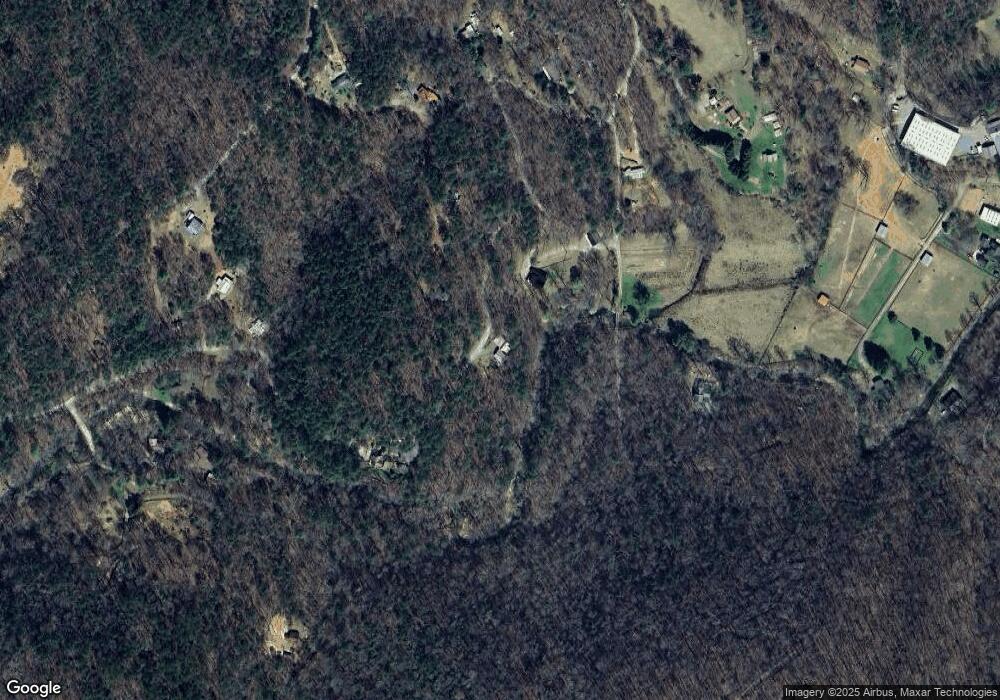
Map
Nearby Homes
- Vacant Tipton Springs Rd
- 79 Stewart Ln
- 2351 Old Dial Rd
- 60 Buckeye Branch Rd
- 185 Mountain Rd
- 558 Tipton Springs Rd
- 177 Mountain Rd
- 335 Mountain Rd
- 158 Mountain Meadows Dr
- 166 Mountain Rd
- 8 Mountain Rd
- 694 Misty Mountain Trail
- 571 Misty Mountain Trail
- 161 Old Dial Rd
- 362 Old Dial Rd
- 16810 Morganton Hwy
- 1628 Tipton Springs Rd
- 1602 Tipton Springs Rd
- 1996 Tipton Springs Rd
- 1854 Tipton Springs Rd
- 1854 Tipton Springs
- 1556 Tipton Springs Rd
- 1543 Tipton Springs Rd
- 1543 Tipton Springs Rd
- 261 Wilscot Creek Trail
- 1981 Tipton Springs Rd
- 1519 Tipton Springs Rd
- 1519 Tipton Springs Rd
- 1063 Tipton Springs Rd
- 1163 Tipton Springs Rd
- 1149 Tipton Springs Rd
- 1051 Tipton Springs Rd
- 57 Wilscott Creek Trail
- 2044 Tipton Springs Rd
- 1253 Tipton Springs Rd
- 2000 Tipton Springs Rd