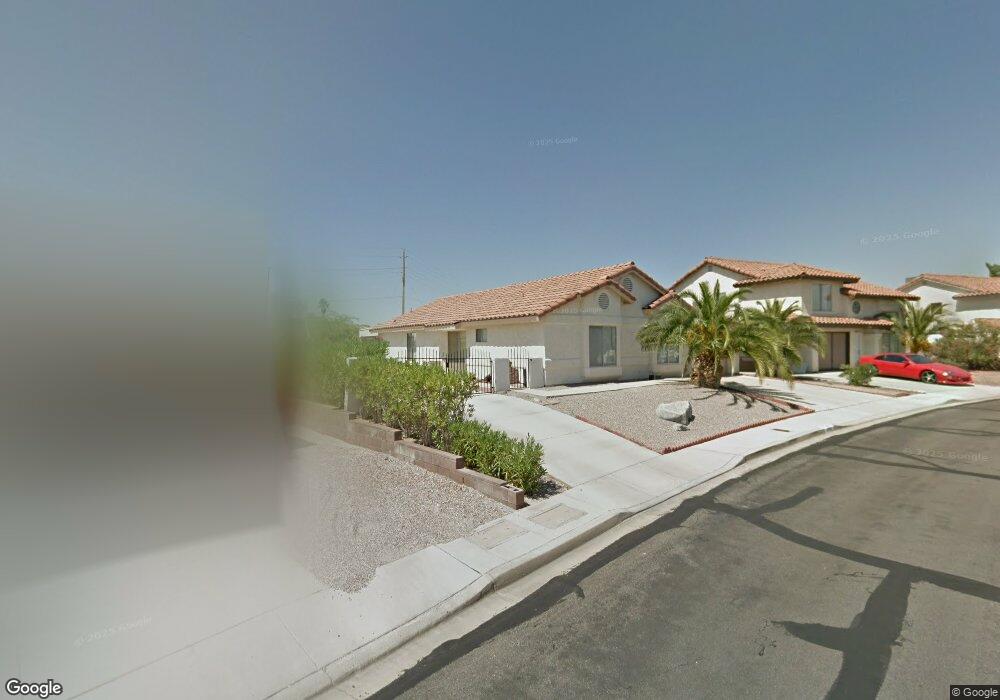
1748 Esteban Ave Laughlin, NV 89029
Estimated Value: $255,821 - $285,000
3
Beds
2
Baths
1,408
Sq Ft
$196/Sq Ft
Est. Value
About This Home
This home is located at 1748 Esteban Ave, Laughlin, NV 89029 and is currently estimated at $275,455, approximately $195 per square foot. 1748 Esteban Ave is a home located in Clark County with nearby schools including William G. Bennett Elementary School and Laughlin Junior/Senior High School.
Ownership History
Date
Name
Owned For
Owner Type
Purchase Details
Closed on
May 4, 2004
Sold by
Degennaro Anthony and Dubiel Patricia
Bought by
Thayer John R and Thayer Gabriella
Current Estimated Value
Purchase Details
Closed on
Jun 19, 2001
Sold by
Pla Charles Holly Money Purchase Pension
Bought by
Degennaro Anthony and Dubiel Patricia
Purchase Details
Closed on
Apr 3, 2001
Sold by
Lapuente Oscar F and Lapuente Maryann Clark
Bought by
Pla Charles Holly Money Purchase Pension
Purchase Details
Closed on
Mar 7, 1995
Sold by
Swaim Robert C and Swaim Alice A
Bought by
Lapuente Oscar F and Lapuente Maryann Clark
Home Financials for this Owner
Home Financials are based on the most recent Mortgage that was taken out on this home.
Original Mortgage
$30,000
Interest Rate
9.03%
Create a Home Valuation Report for This Property
The Home Valuation Report is an in-depth analysis detailing your home's value as well as a comparison with similar homes in the area
Purchase History
| Date | Buyer | Sale Price | Title Company |
|---|---|---|---|
| Thayer John R | $135,000 | First American Title Co Of | |
| Degennaro Anthony | $103,500 | United Title | |
| Pla Charles Holly Money Purchase Pension | $81,351 | -- | |
| Lapuente Oscar F | $100,000 | Land Title |
Source: Public Records
Mortgage History
| Date | Status | Borrower | Loan Amount |
|---|---|---|---|
| Previous Owner | Lapuente Oscar F | $30,000 |
Source: Public Records
Tax History
| Year | Tax Paid | Tax Assessment Tax Assessment Total Assessment is a certain percentage of the fair market value that is determined by local assessors to be the total taxable value of land and additions on the property. | Land | Improvement |
|---|---|---|---|---|
| 2026 | $1,275 | $49,097 | $14,700 | $34,397 |
| 2025 | $1,239 | $48,425 | $13,300 | $35,125 |
| 2024 | $1,203 | $48,425 | $13,300 | $35,125 |
| 2023 | $1,203 | $53,664 | $19,600 | $34,064 |
| 2022 | $1,168 | $47,154 | $15,750 | $31,404 |
| 2021 | $1,134 | $43,840 | $13,650 | $30,190 |
| 2020 | $1,099 | $43,860 | $13,650 | $30,210 |
| 2019 | $1,067 | $41,681 | $11,550 | $30,131 |
| 2018 | $1,036 | $40,320 | $11,200 | $29,120 |
| 2017 | $1,354 | $40,447 | $10,850 | $29,597 |
| 2016 | $980 | $37,101 | $7,000 | $30,101 |
| 2015 | $978 | $33,414 | $5,250 | $28,164 |
| 2014 | $950 | $27,533 | $5,250 | $22,283 |
Source: Public Records
Map
Nearby Homes
- 3048 Soledad Dr
- 1826 Dunes Ct
- 3095 Quantana Way
- 1596 Paloma Ave
- 3176 Arroya Ct
- 1595 Paloma Ave
- 1615 Granada St
- 3253 Calanda St
- 3250 Mirador St
- 2888 Cattail Cove St
- 3262 Del Monte St
- 2926 Shimmering Bay St
- 1940 Las Palmas Ln Unit 171
- 1940 Las Palmas Ln Unit 272
- 2016 Mesquite Ln Unit 302
- 2016 Mesquite Ln Unit 104
- 1972 Las Palmas Ln Unit 251
- 1972 Las Palmas Ln Unit 249
- 1948 Las Palmas Ln Unit 277
- 1948 Las Palmas Ln Unit 279
- 1744 Esteban Ave
- 1752 Esteban Ave
- 1740 Esteban Ave
- 1756 Esteban Ave
- 1743 Esteban Ave
- 1751 Esteban Ave
- 1736 Esteban Ave
- 1739 Esteban Ave
- 1760 Esteban Ave
- 1759 Esteban Ave
- 1735 Esteban Ave
- 2985 Palo Verde Dr
- 1732 Esteban Ave
- 1732 Esteban Ave Unit 4
- 2952 La Palma Dr
- 2952 La Palma Dr
- 2944 La Palma Dr
- 2960 La Palma Dr
- 1764 Esteban Ave
- 1731 Esteban Ave
Your Personal Tour Guide
Ask me questions while you tour the home.