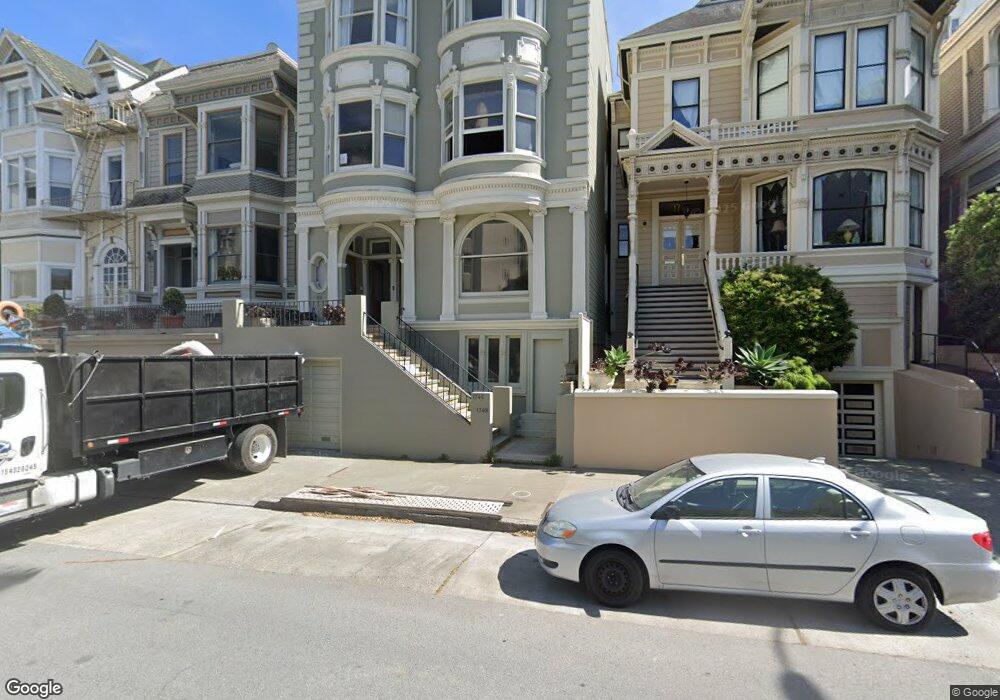
1749 Broadway San Francisco, CA 94109
Pacific Heights NeighborhoodEstimated Value: $1,853,000 - $2,606,000
3
Beds
2
Baths
2,008
Sq Ft
$1,056/Sq Ft
Est. Value
About This Home
This home is located at 1749 Broadway, San Francisco, CA 94109 and is currently estimated at $2,120,547, approximately $1,056 per square foot. 1749 Broadway is a home located in San Francisco County with nearby schools including Sherman Elementary, Marina Middle School, and Mary L. Booker Leadership Academy.
Ownership History
Date
Name
Owned For
Owner Type
Purchase Details
Closed on
Apr 20, 2017
Sold by
Shin Jeannie J
Bought by
Shin Jeannie J
Current Estimated Value
Purchase Details
Closed on
Feb 22, 2011
Sold by
Scheu Michael R and Van Winkle Frederick S
Bought by
Shin Jeannie J
Home Financials for this Owner
Home Financials are based on the most recent Mortgage that was taken out on this home.
Original Mortgage
$60,000
Outstanding Balance
$41,148
Interest Rate
4.75%
Mortgage Type
Credit Line Revolving
Estimated Equity
$2,079,399
Purchase Details
Closed on
Dec 11, 2009
Sold by
Aal Scott J and Brown Julie F
Bought by
Scheu Michael R and Van Winkle Jr Frederick S
Home Financials for this Owner
Home Financials are based on the most recent Mortgage that was taken out on this home.
Original Mortgage
$645,000
Interest Rate
4.37%
Mortgage Type
New Conventional
Create a Home Valuation Report for This Property
The Home Valuation Report is an in-depth analysis detailing your home's value as well as a comparison with similar homes in the area
Home Values in the Area
Average Home Value in this Area
Purchase History
| Date | Buyer | Sale Price | Title Company |
|---|---|---|---|
| Shin Jeannie J | -- | None Available | |
| Shin Jeannie J | $1,162,500 | Fidelity National Title Co | |
| Scheu Michael R | -- | First American Title Company |
Source: Public Records
Mortgage History
| Date | Status | Borrower | Loan Amount |
|---|---|---|---|
| Open | Shin Jeannie J | $60,000 | |
| Open | Shin Jeannie J | $928,000 | |
| Previous Owner | Scheu Michael R | $645,000 |
Source: Public Records
Tax History Compared to Growth
Tax History
| Year | Tax Paid | Tax Assessment Tax Assessment Total Assessment is a certain percentage of the fair market value that is determined by local assessors to be the total taxable value of land and additions on the property. | Land | Improvement |
|---|---|---|---|---|
| 2025 | $19,734 | $1,641,810 | $744,679 | $897,131 |
| 2024 | $19,734 | $1,609,619 | $730,078 | $879,541 |
| 2023 | $19,393 | $1,578,059 | $715,763 | $862,296 |
| 2022 | $19,011 | $1,547,118 | $701,729 | $845,389 |
| 2021 | $18,675 | $1,516,784 | $687,970 | $828,814 |
| 2020 | $18,757 | $1,501,232 | $680,916 | $820,316 |
| 2019 | $18,115 | $1,471,797 | $667,565 | $804,232 |
| 2018 | $17,507 | $1,442,940 | $654,476 | $788,464 |
| 2017 | $17,002 | $1,414,649 | $641,644 | $773,005 |
| 2016 | $16,733 | $1,386,912 | $629,063 | $757,849 |
| 2015 | $16,526 | $1,366,080 | $619,614 | $746,466 |
| 2014 | $14,632 | $1,214,954 | $607,477 | $607,477 |
Source: Public Records
Map
Nearby Homes
- 1896 Pacific Ave Unit 202
- 1896 Pacific Ave Unit 404
- 2145 Franklin St Unit 1
- 1650 Broadway Unit 104
- 1623 Vallejo St
- 1830 Jackson St Unit E
- 2040 Franklin St Unit 502
- 2315 Van Ness Ave Unit 2
- 2160 Van Ness Ave
- 2000 Washington St Unit 4
- 2006 Washington St Unit 4
- 1940 Broadway Unit 2W
- 1701 Jackson St Unit 209
- 1701 Jackson St Unit 105
- 1776 Green St Unit 201
- 1971 Broadway
- 1650 Jackson St Unit 707
- 1601 Pacific Ave Unit 207
- 1568 Union St Unit 301
- 1998 Vallejo St Unit 2
- 1745 Broadway
- 1751 Broadway
- 1739 Broadway Unit A
- 1737 Broadway
- 1759 Broadway Unit 1765
- 1769 Broadway Unit 11
- 1769 Broadway Unit 5
- 1769 Broadway Unit 9
- 1769 Broadway Unit 16
- 1769 Broadway Unit 13
- 1769 Broadway Unit 10
- 1769 Broadway Unit 14
- 1769 Broadway Unit 8
- 1769 Broadway Unit 7
- 1769 Broadway Unit 4
- 1769 Broadway Unit 3
- 1769 Broadway Unit 2
- 1769 Broadway Unit 1
- 1775 Broadway Unit 8
- 1775 Broadway Unit 9