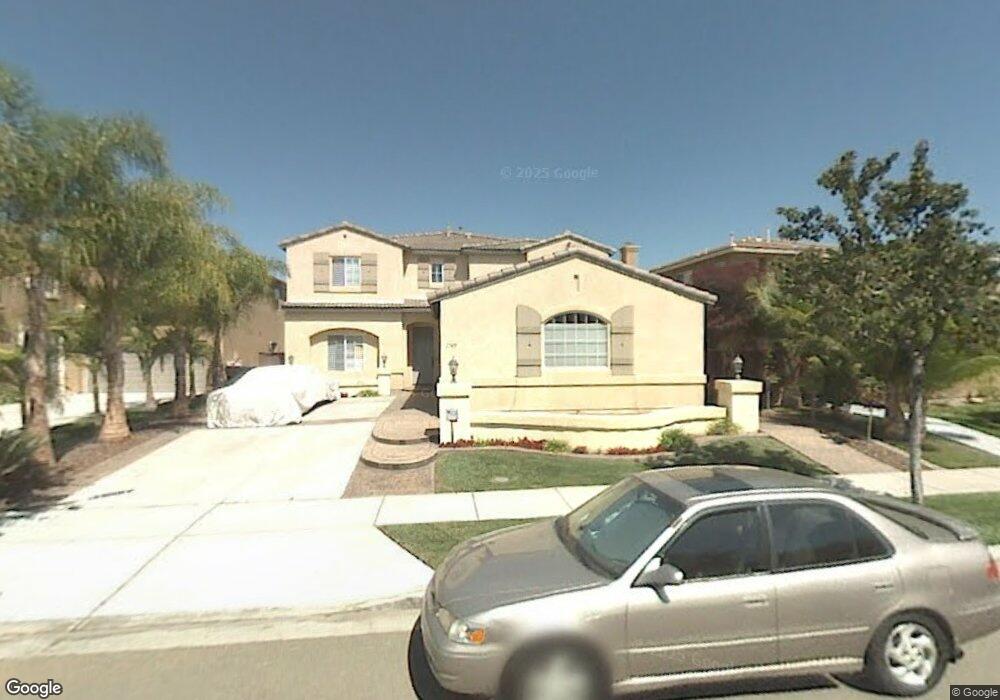
1749 Lone Tree Rd Chula Vista, CA 91913
Otay Ranch Village NeighborhoodEstimated Value: $1,077,138 - $1,243,000
4
Beds
3
Baths
2,944
Sq Ft
$397/Sq Ft
Est. Value
About This Home
This home is located at 1749 Lone Tree Rd, Chula Vista, CA 91913 and is currently estimated at $1,169,535, approximately $397 per square foot. 1749 Lone Tree Rd is a home located in San Diego County with nearby schools including Corky McMillin Elementary School, Rancho Del Rey Middle School, and Olympian High School.
Ownership History
Date
Name
Owned For
Owner Type
Purchase Details
Closed on
Sep 16, 2016
Sold by
Gonzales John P
Bought by
Gonzles John P and Gonzales Brenda Q
Current Estimated Value
Purchase Details
Closed on
Jul 3, 2003
Sold by
Gonzales John P and Gonzales Brenda Q
Bought by
Gonzales John Paul and Gonzales Brenda Q
Home Financials for this Owner
Home Financials are based on the most recent Mortgage that was taken out on this home.
Original Mortgage
$316,000
Outstanding Balance
$133,942
Interest Rate
5.22%
Mortgage Type
Purchase Money Mortgage
Estimated Equity
$1,035,593
Purchase Details
Closed on
Sep 14, 2000
Sold by
Montecito At Lomas Verdes L L C
Bought by
Gonzales John P and Gonzales Brenda Q
Home Financials for this Owner
Home Financials are based on the most recent Mortgage that was taken out on this home.
Original Mortgage
$269,950
Interest Rate
6.98%
Create a Home Valuation Report for This Property
The Home Valuation Report is an in-depth analysis detailing your home's value as well as a comparison with similar homes in the area
Home Values in the Area
Average Home Value in this Area
Purchase History
| Date | Buyer | Sale Price | Title Company |
|---|---|---|---|
| Gonzles John P | -- | None Available | |
| Gonzales John P | -- | None Available | |
| Gonzales John P | -- | None Available | |
| Gonzales John Paul | -- | Fidelity National Title Co | |
| Gonzales John P | $337,500 | First American Title Ins Co |
Source: Public Records
Mortgage History
| Date | Status | Borrower | Loan Amount |
|---|---|---|---|
| Open | Gonzales John Paul | $316,000 | |
| Previous Owner | Gonzales John P | $269,950 | |
| Closed | Gonzales John Paul | $132,000 |
Source: Public Records
Tax History Compared to Growth
Tax History
| Year | Tax Paid | Tax Assessment Tax Assessment Total Assessment is a certain percentage of the fair market value that is determined by local assessors to be the total taxable value of land and additions on the property. | Land | Improvement |
|---|---|---|---|---|
| 2025 | $6,623 | $508,388 | $165,742 | $342,646 |
| 2024 | $6,623 | $498,421 | $162,493 | $335,928 |
| 2023 | $8,983 | $488,649 | $159,307 | $329,342 |
| 2022 | $8,727 | $479,069 | $156,184 | $322,885 |
| 2021 | $8,553 | $469,676 | $153,122 | $316,554 |
| 2020 | $8,365 | $464,861 | $151,552 | $313,309 |
| 2019 | $8,172 | $455,747 | $148,581 | $307,166 |
| 2018 | $8,039 | $446,812 | $145,668 | $301,144 |
| 2017 | $7,894 | $438,052 | $142,812 | $295,240 |
| 2016 | $7,706 | $429,463 | $140,012 | $289,451 |
| 2015 | $7,611 | $423,013 | $137,909 | $285,104 |
| 2014 | $7,571 | $414,728 | $135,208 | $279,520 |
Source: Public Records
Map
Nearby Homes
- 1733 Mendota St
- 1633 Quailsprings Ct
- 1757 Via Capri
- 1626 Coolsprings Ct
- 1908 Petaluma Dr
- 1306 Mill Valley Rd
- 1153 Gustine St
- 1760 E Palomar St Unit 318
- 1760 E Palomar St Unit 111
- 1781 Camino Strava Unit 1
- 1719 Avenida Tealing Unit 2
- 1711 Avenida Tealing
- 1761 Harvard St
- 1579 Apache Dr Unit E
- 1279 Fools Gold Way Unit 2
- 1925 Otay Lakes Rd Unit 78
- 1925 Otay Lakes Rd Unit 136
- 1925 Otay Lakes Rd Unit 39
- 1925 Otay Lakes Rd Unit 69
- 1925 Otay Lakes Rd Unit 43
- 1745 Lone Tree Rd
- 1757 Lone Tree Rd
- 1741 Lone Tree Rd
- 1761 Lone Tree Rd
- 1748 Fernwood Rd
- 1744 Fernwood Rd Unit 3
- 1752 Fernwood Rd
- 1737 Lone Tree Rd Unit 3
- 1765 Lone Tree Rd
- 1740 Fernwood Rd
- 1756 Fernwood Rd
- 1750 Lone Tree Rd Unit 3
- 1754 Lone Tree Rd
- 1746 Lone Tree Rd
- 1758 Lone Tree Rd Unit 3
- 1736 Fernwood Rd
- 1742 Lone Tree Rd
- 1760 Fernwood Rd
- 1762 Lone Tree Rd
- 1096 Breezewood Dr