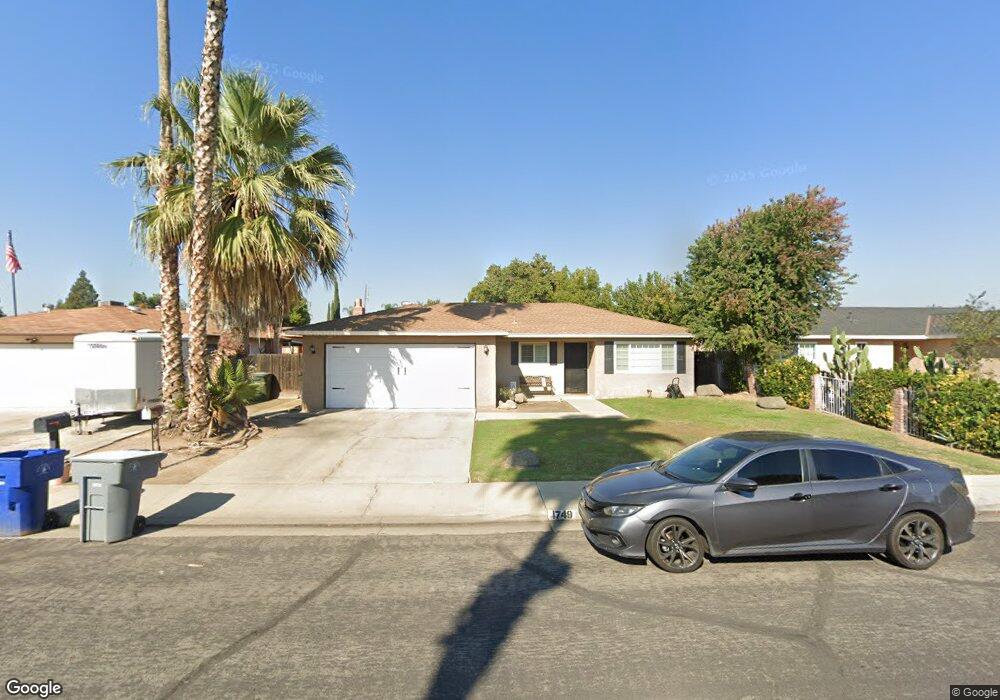
1749 Sussex Ave Clovis, CA 93611
McLane NeighborhoodEstimated Value: $353,353 - $386,000
3
Beds
2
Baths
1,290
Sq Ft
$283/Sq Ft
Est. Value
About This Home
This home is located at 1749 Sussex Ave, Clovis, CA 93611 and is currently estimated at $365,088, approximately $283 per square foot. 1749 Sussex Ave is a home located in Fresno County with nearby schools including Miramonte Elementary School, Reyburn Intermediate School, and Clovis East High School.
Ownership History
Date
Name
Owned For
Owner Type
Purchase Details
Closed on
May 13, 2003
Sold by
Subia Johnnie and Subia Norma
Bought by
Ramos Rochelle
Current Estimated Value
Home Financials for this Owner
Home Financials are based on the most recent Mortgage that was taken out on this home.
Original Mortgage
$135,584
Outstanding Balance
$58,154
Interest Rate
5.61%
Mortgage Type
FHA
Estimated Equity
$306,934
Purchase Details
Closed on
Jan 22, 2003
Sold by
Kanesaki Donald K and Schwartz Gary Alan
Bought by
Subia Johnnie and Subia Norma
Home Financials for this Owner
Home Financials are based on the most recent Mortgage that was taken out on this home.
Original Mortgage
$117,050
Interest Rate
5.89%
Purchase Details
Closed on
Mar 14, 1994
Sold by
Kanesaki Donald K
Bought by
Kanesaki Donald K and Schwartz Gary Alan
Home Financials for this Owner
Home Financials are based on the most recent Mortgage that was taken out on this home.
Original Mortgage
$48,875
Interest Rate
6.74%
Create a Home Valuation Report for This Property
The Home Valuation Report is an in-depth analysis detailing your home's value as well as a comparison with similar homes in the area
Home Values in the Area
Average Home Value in this Area
Purchase History
| Date | Buyer | Sale Price | Title Company |
|---|---|---|---|
| Ramos Rochelle | $137,500 | Fidelity National Title Co | |
| Subia Johnnie | $130,500 | National Title Company | |
| Kanesaki Donald K | -- | Chicago Title |
Source: Public Records
Mortgage History
| Date | Status | Borrower | Loan Amount |
|---|---|---|---|
| Open | Ramos Rochelle | $135,584 | |
| Previous Owner | Subia Johnnie | $117,050 | |
| Previous Owner | Kanesaki Donald K | $48,875 | |
| Closed | Ramos Rochelle | $9,000 |
Source: Public Records
Tax History Compared to Growth
Tax History
| Year | Tax Paid | Tax Assessment Tax Assessment Total Assessment is a certain percentage of the fair market value that is determined by local assessors to be the total taxable value of land and additions on the property. | Land | Improvement |
|---|---|---|---|---|
| 2025 | $2,361 | $199,125 | $37,646 | $161,479 |
| 2023 | $2,272 | $191,394 | $36,185 | $155,209 |
| 2022 | $2,242 | $187,642 | $35,476 | $152,166 |
| 2021 | $2,097 | $183,964 | $34,781 | $149,183 |
| 2020 | $2,088 | $182,079 | $34,425 | $147,654 |
| 2019 | $2,046 | $178,509 | $33,750 | $144,759 |
| 2018 | $2,000 | $175,010 | $33,089 | $141,921 |
| 2017 | $1,965 | $171,580 | $32,441 | $139,139 |
| 2016 | $1,687 | $150,200 | $28,100 | $122,100 |
| 2015 | $1,514 | $135,400 | $25,400 | $110,000 |
| 2014 | $1,416 | $126,800 | $23,800 | $103,000 |
Source: Public Records
Map
Nearby Homes
- 6008 E Sussex Way
- 1916 Ashlan Ave
- 5934 E Dakota Ave
- 6165 E Farrin Ave
- 1717 Swift Ave
- 6157 E Garland Ave
- 5739 E Hampton Way
- 3550 N Duke Ave Unit 37
- 3550 N Duke Ave Unit 10
- 3550 N Duke Ave Unit 12
- 3556 N Duke Ave Unit 165
- 6406 E Giavanna Ave
- 1438 Indianapolis Ave
- 5703 E Hampton Way
- 2932 Claremont Ave
- 4065 N Eddy Ave
- 1608 Gettysburg Ave
- 3605 Phillip Ave
- 3734 Manila Ave
- 5965 E Shields Ave Unit 178
- 1735 Sussex Ave
- 1763 Sussex Ave
- 1736 Bellaire Ave
- 1750 Bellaire Ave
- 1711 Sussex Ave
- 1775 Sussex Ave
- 1722 Bellaire Ave
- 1764 Bellaire Ave
- 1746 Sussex Ave
- 1708 Bellaire Ave
- 1760 Sussex Ave
- 1724 Sussex Ave
- 1699 Sussex Ave
- 1785 Sussex Ave
- 1772 Sussex Ave
- 1780 Bellaire Ave
- 1706 Sussex Ave
- 1784 Sussex Ave
- 1689 Sussex Ave
- 1795 Sussex Ave