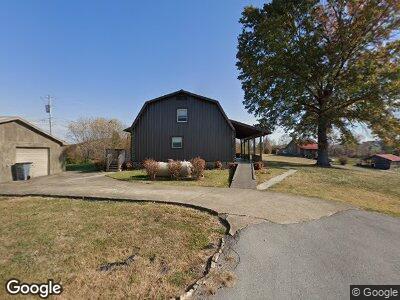
175 Lazy Brook Rd Chuckey, TN 37641
Estimated Value: $215,979 - $347,000
--
Bed
2
Baths
2,030
Sq Ft
$147/Sq Ft
Est. Value
About This Home
This home is located at 175 Lazy Brook Rd, Chuckey, TN 37641 and is currently estimated at $297,495, approximately $146 per square foot. 175 Lazy Brook Rd is a home located in Greene County with nearby schools including Chuckey Elementary School, Chuckey Doak Middle School, and Chuckey Doak High School.
Ownership History
Date
Name
Owned For
Owner Type
Purchase Details
Closed on
May 18, 2021
Sold by
Kiker Louise Daniels
Bought by
Jennings Sheila Ann and Kiker David Bretley
Current Estimated Value
Create a Home Valuation Report for This Property
The Home Valuation Report is an in-depth analysis detailing your home's value as well as a comparison with similar homes in the area
Home Values in the Area
Average Home Value in this Area
Purchase History
| Date | Buyer | Sale Price | Title Company |
|---|---|---|---|
| Jennings Sheila Ann | -- | None Available |
Source: Public Records
Tax History Compared to Growth
Tax History
| Year | Tax Paid | Tax Assessment Tax Assessment Total Assessment is a certain percentage of the fair market value that is determined by local assessors to be the total taxable value of land and additions on the property. | Land | Improvement |
|---|---|---|---|---|
| 2024 | $823 | $49,850 | $4,850 | $45,000 |
| 2023 | $0 | $49,850 | $0 | $0 |
| 2022 | $525 | $26,075 | $3,350 | $22,725 |
| 2021 | $525 | $26,075 | $3,350 | $22,725 |
| 2020 | $525 | $26,075 | $3,350 | $22,725 |
| 2019 | $525 | $26,075 | $3,350 | $22,725 |
| 2018 | $525 | $26,050 | $3,350 | $22,700 |
| 2017 | $506 | $25,650 | $3,400 | $22,250 |
| 2016 | $480 | $25,650 | $3,400 | $22,250 |
| 2015 | $480 | $25,650 | $3,400 | $22,250 |
| 2014 | $480 | $25,650 | $3,400 | $22,250 |
Source: Public Records
Map
Nearby Homes
- 655 Old Snapps Ferry Rd
- Tbd Rheatown Rd
- 1335 Old Snapps Ferry Rd
- 1590 Old Snapps Ferry Rd
- 330 Robertson Rd
- 4773&4775 Rheatown Rd
- 00 Kingsport Hwy
- 8185 Kingsport Hwy
- Lot 13 Rheatown Rd
- 0 Rheatown Rd
- 2200 Rd
- 2200 Rd
- 810 Sugar Bowl Rd
- 1125 Sugar Bowl Rd
- 50 Idell Cir
- Lot 43 Chimney Top Ln
- Lot 35 Chimney Top Ln
- Lot 48 Chimney Top Ln
- 865 Chimney Top Ln
- 765 Chimney Top Ln
- 175 Lazy Brook Rd
- - Lazy Brook Rd
- 0 Lazy Brook Rd
- TBD Lazy Brook Rd
- 195 Lazy Brook Rd
- 135 Lazy Brook Rd
- 170 Lazy Brook Rd
- 60 Lazy Brook Rd
- 662 Old Snapps Ferry Rd
- 682 Old Snapps Ferry Rd
- 620 Old Snapps Ferry Rd
- 770 Old Snapps Ferry Rd
- 255 Lazy Brook Rd
- 290 Lazy Brook Rd
- 645 Old Snapps Ferry Rd
- 625 Old Snapps Ferry Rd
- 725 Old Snapps Ferry Rd
- 605 Old Snapps Ferry Rd
- TBD Old Snapps Ferry
- TBD Old Snaps Ferry Rd