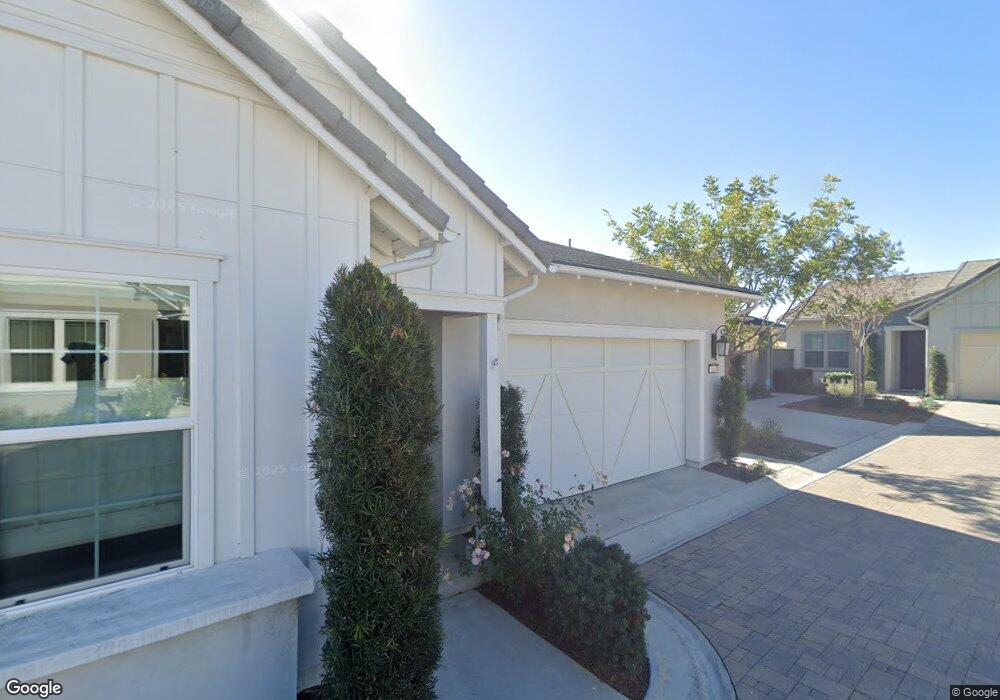
175 Luneta Ln Rancho Mission Viejo, CA 92694
Estimated Value: $1,139,000 - $1,269,000
2
Beds
2
Baths
1,569
Sq Ft
$769/Sq Ft
Est. Value
About This Home
This home is located at 175 Luneta Ln, Rancho Mission Viejo, CA 92694 and is currently estimated at $1,206,155, approximately $768 per square foot. 175 Luneta Ln is a home with nearby schools including Esencia and Tesoro High School.
Ownership History
Date
Name
Owned For
Owner Type
Purchase Details
Closed on
Jul 26, 2023
Sold by
Randall John Patrick and Randall Patricia Lea
Bought by
Randall Family Trust and Randall
Current Estimated Value
Purchase Details
Closed on
Jul 2, 2019
Sold by
Pulte Home Company Llc
Bought by
Lea Randall John Patrick and Lea Randall Patricia
Home Financials for this Owner
Home Financials are based on the most recent Mortgage that was taken out on this home.
Original Mortgage
$550,000
Interest Rate
3.82%
Mortgage Type
New Conventional
Create a Home Valuation Report for This Property
The Home Valuation Report is an in-depth analysis detailing your home's value as well as a comparison with similar homes in the area
Home Values in the Area
Average Home Value in this Area
Purchase History
| Date | Buyer | Sale Price | Title Company |
|---|---|---|---|
| Randall Family Trust | -- | None Listed On Document | |
| Lea Randall John Patrick | $740,500 | First American Title Company |
Source: Public Records
Mortgage History
| Date | Status | Borrower | Loan Amount |
|---|---|---|---|
| Previous Owner | Lea Randall John Patrick | $550,000 |
Source: Public Records
Tax History Compared to Growth
Tax History
| Year | Tax Paid | Tax Assessment Tax Assessment Total Assessment is a certain percentage of the fair market value that is determined by local assessors to be the total taxable value of land and additions on the property. | Land | Improvement |
|---|---|---|---|---|
| 2025 | $7,500 | $324,766 | $111,552 | $213,214 |
| 2024 | $7,500 | $318,399 | $109,365 | $209,034 |
| 2023 | $7,462 | $312,156 | $107,220 | $204,936 |
| 2022 | $7,343 | $306,036 | $105,118 | $200,918 |
| 2021 | $7,302 | $300,036 | $103,057 | $196,979 |
| 2020 | $7,670 | $296,960 | $102,000 | $194,960 |
| 2019 | $7,439 | $256,185 | $256,185 | $0 |
| 2018 | $7,482 | $251,162 | $251,162 | $0 |
Source: Public Records
Map
Nearby Homes