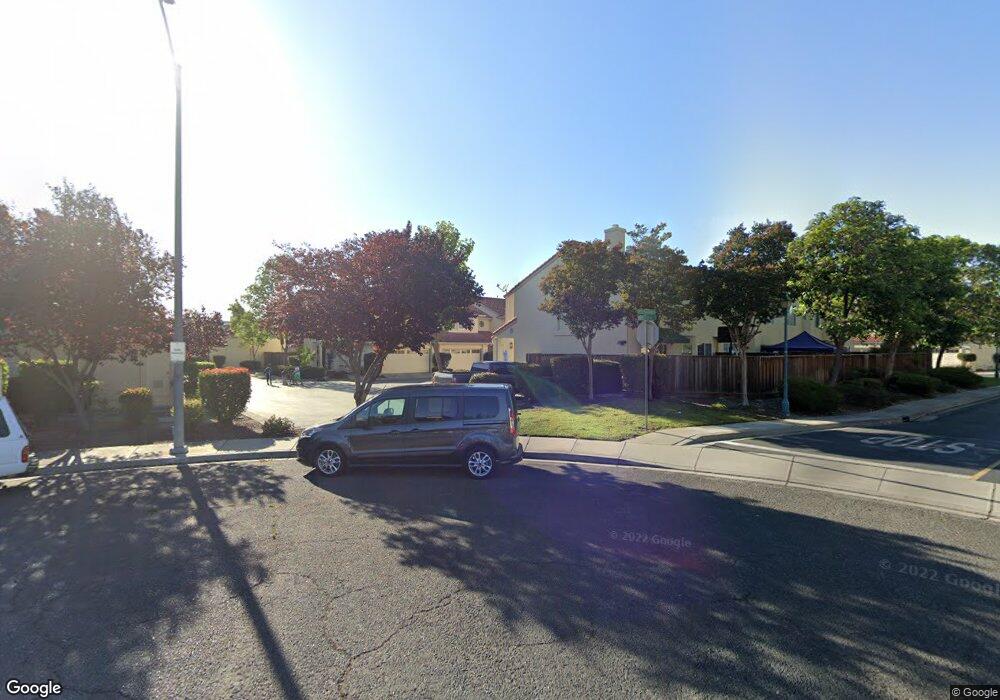
175 Millwater Ct Milpitas, CA 95035
Estimated Value: $1,028,587 - $1,158,000
2
Beds
3
Baths
1,280
Sq Ft
$863/Sq Ft
Est. Value
About This Home
This home is located at 175 Millwater Ct, Milpitas, CA 95035 and is currently estimated at $1,104,397, approximately $862 per square foot. 175 Millwater Ct is a home located in Santa Clara County with nearby schools including Curtner Elementary School, Thomas Russell Middle School, and Milpitas High School.
Ownership History
Date
Name
Owned For
Owner Type
Purchase Details
Closed on
Sep 29, 2020
Sold by
Kaiser Scott and Kaiser Julie
Bought by
Kaiser Family Trust and Kaiser
Current Estimated Value
Purchase Details
Closed on
Jan 26, 2005
Sold by
Kaiser Scott and Kaiser Julie
Bought by
Kaiser Scott and Kaiser Julie
Purchase Details
Closed on
Jan 27, 2003
Sold by
Kaiser Scott A
Bought by
Kaiser Scott A and Kaiser Julie A
Home Financials for this Owner
Home Financials are based on the most recent Mortgage that was taken out on this home.
Original Mortgage
$295,000
Interest Rate
5.97%
Purchase Details
Closed on
Nov 15, 1994
Sold by
Shapell Industries Inc
Bought by
Kaiser Scott A
Home Financials for this Owner
Home Financials are based on the most recent Mortgage that was taken out on this home.
Original Mortgage
$161,700
Interest Rate
3.95%
Create a Home Valuation Report for This Property
The Home Valuation Report is an in-depth analysis detailing your home's value as well as a comparison with similar homes in the area
Home Values in the Area
Average Home Value in this Area
Purchase History
| Date | Buyer | Sale Price | Title Company |
|---|---|---|---|
| Kaiser Family Trust | -- | Amrock | |
| Kaiser Scott | -- | -- | |
| Kaiser Scott A | -- | Fidelity National Title Ins | |
| Kaiser Scott A | $180,000 | Santa Clara Land Title Co |
Source: Public Records
Mortgage History
| Date | Status | Borrower | Loan Amount |
|---|---|---|---|
| Previous Owner | Kaiser Scott A | $295,000 | |
| Previous Owner | Kaiser Scott A | $161,700 |
Source: Public Records
Tax History
| Year | Tax Paid | Tax Assessment Tax Assessment Total Assessment is a certain percentage of the fair market value that is determined by local assessors to be the total taxable value of land and additions on the property. | Land | Improvement |
|---|---|---|---|---|
| 2025 | $3,608 | $301,808 | $142,757 | $159,051 |
| 2024 | $3,608 | $295,891 | $139,958 | $155,933 |
| 2023 | $3,597 | $290,090 | $137,214 | $152,876 |
| 2022 | $3,588 | $284,403 | $134,524 | $149,879 |
| 2021 | $3,537 | $278,828 | $131,887 | $146,941 |
| 2020 | $3,477 | $275,970 | $130,535 | $145,435 |
| 2019 | $3,440 | $270,560 | $127,976 | $142,584 |
| 2018 | $3,274 | $265,256 | $125,467 | $139,789 |
| 2017 | $3,233 | $260,056 | $123,007 | $137,049 |
| 2016 | $3,100 | $254,958 | $120,596 | $134,362 |
| 2015 | $3,070 | $251,129 | $118,785 | $132,344 |
| 2014 | $2,977 | $246,211 | $116,459 | $129,752 |
Source: Public Records
Map
Nearby Homes
- 0 Railroad Ave
- 7280 Marylinn Dr
- 102 Marylinn Dr
- 170 Marylinn Dr
- 137 Caladenia Ln
- 50 Serra Way
- 175 Barker St
- 207 Redwood Ave
- 60 Jacklin Place
- 353 San Miguel Ct Unit 2
- 1006 N Abbott Ave
- 1008 N Abbott Ave
- 295 Rio Verde Place Unit 4
- 685 Parvin Dr
- 527 Maple Ave
- 690 Claridad Loop Unit 11E
- 808 Cameron Cir
- 513 Glenmoor Cir
- 969 Mente Linda Loop Unit 6G
- 660 S Main St
- 167 Millwater Ct
- 183 Millwater Ct
- 159 Millwater Ct
- 178 Millwater Ct
- 170 Millwater Ct
- 186 Millwater Ct
- 162 Millwater Ct
- 195 Waterford Meadow Ct
- 203 Waterford Meadow Ct
- 134 Millwater Ct
- 142 Millwater Ct
- 150 Millwater Ct
- 158 Millwater Ct
- 211 Waterford Meadow Ct
- 219 Waterford Meadow Ct
- 169 Sagemeadow Ct
- 177 Sagemeadow Ct
- 161 Sagemeadow Ct
- 206 Sagemeadow Ct
- 197 Fairmeadow Way
Your Personal Tour Guide
Ask me questions while you tour the home.