175 Mountain View Dr Tustin, CA 92780
Estimated Value: $1,379,000 - $1,759,000
4
Beds
4
Baths
3,118
Sq Ft
$510/Sq Ft
Est. Value
About This Home
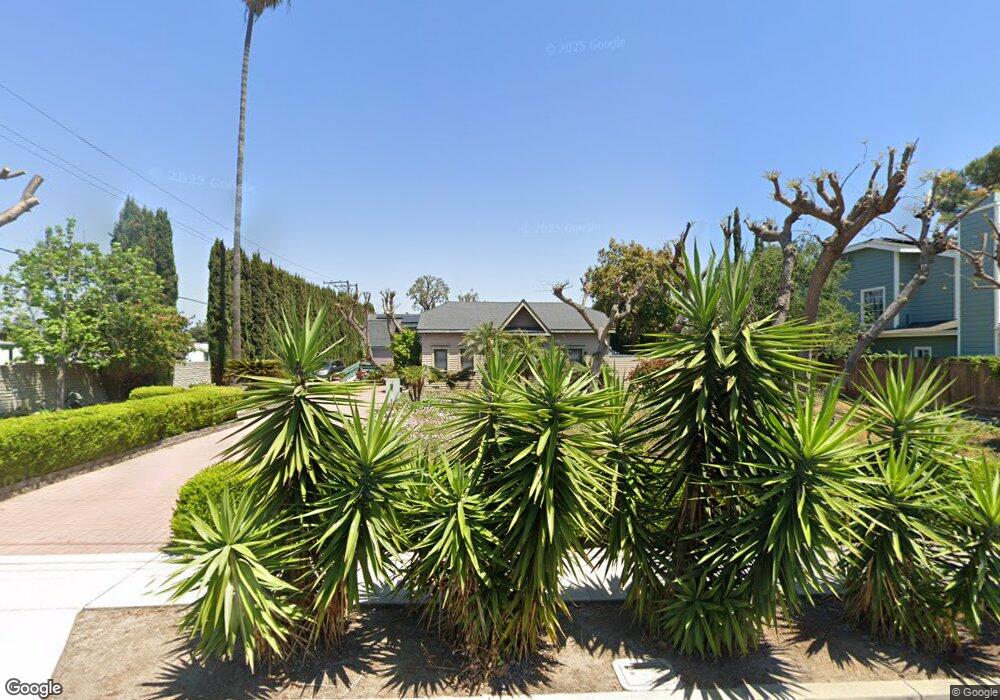
This home is located at 175 Mountain View Dr, Tustin, CA 92780 and is currently estimated at $1,589,824, approximately $509 per square foot. 175 Mountain View Dr is a home located in Orange County with nearby schools including Helen Estock Elementary School, Columbus Tustin Middle School, and Foothill High School.
Ownership History
Date
Name
Owned For
Owner Type
Purchase Details
Closed on
Jun 18, 2020
Sold by
Shumar James Wilmer and Shumar Jennifer Whitford
Bought by
Shumar James Wilmer and Shumar Jennifer Whiford
Current Estimated Value
Purchase Details
Closed on
May 6, 2004
Sold by
Shumar James Wilmer and Shumar Jennifer Whitford
Bought by
Shumar James Wilmer and Shumar Jennifer Whitford
Purchase Details
Closed on
Jul 5, 2002
Sold by
Shumar James Wilmer and Shumar Jennifer Whitford
Bought by
The Jw Shumar Family Ltd Partnership
Purchase Details
Closed on
Sep 25, 1997
Sold by
Shumar James W and Shumar Jennifer
Bought by
Shumar James W and Shumar Jennifer
Home Financials for this Owner
Home Financials are based on the most recent Mortgage that was taken out on this home.
Original Mortgage
$272,000
Interest Rate
10.25%
Create a Home Valuation Report for This Property
The Home Valuation Report is an in-depth analysis detailing your home's value as well as a comparison with similar homes in the area
Home Values in the Area
Average Home Value in this Area
Purchase History
| Date | Buyer | Sale Price | Title Company |
|---|---|---|---|
| Shumar James Wilmer | -- | None Available | |
| Shumar James Wilmer | -- | -- | |
| The Jw Shumar Family Ltd Partnership | -- | -- | |
| Shumar James W | -- | Stewart Title | |
| Shumar James W | $154,000 | Stewart Title |
Source: Public Records
Mortgage History
| Date | Status | Borrower | Loan Amount |
|---|---|---|---|
| Previous Owner | Shumar James W | $272,000 |
Source: Public Records
Tax History
| Year | Tax Paid | Tax Assessment Tax Assessment Total Assessment is a certain percentage of the fair market value that is determined by local assessors to be the total taxable value of land and additions on the property. | Land | Improvement |
|---|---|---|---|---|
| 2025 | $5,363 | $470,483 | $299,505 | $170,978 |
| 2024 | $5,363 | $461,258 | $293,632 | $167,626 |
| 2023 | $5,228 | $452,214 | $287,874 | $164,340 |
| 2022 | $5,144 | $443,348 | $282,230 | $161,118 |
| 2021 | $5,041 | $434,655 | $276,696 | $157,959 |
| 2020 | $5,014 | $430,199 | $273,859 | $156,340 |
| 2019 | $4,893 | $421,764 | $268,489 | $153,275 |
| 2018 | $4,813 | $413,495 | $263,225 | $150,270 |
| 2017 | $4,729 | $405,388 | $258,064 | $147,324 |
| 2016 | $4,645 | $397,440 | $253,004 | $144,436 |
| 2015 | $4,712 | $391,471 | $249,204 | $142,267 |
| 2014 | $4,592 | $383,803 | $244,322 | $139,481 |
Source: Public Records
Map
Nearby Homes
- 428 W 1st St
- 17481 Amaganset Way
- 16869 Donwest
- 16865 Donwest Unit 71
- 17732 Amaganset Way
- 601 Handley Ct
- 141 E Coronado Ln
- 17926 Irvine Blvd
- 17956 Irvine Blvd
- 125 De Soto Ln
- 133 De Soto Ln
- 15500 Tustin Village Way Unit 103
- 14272 Acacia Dr
- 39 Via Entrada
- 131 Colombo Ln
- 133 Colombo Ln
- 16629 Montego Way
- 124 Balboa Ln
- 15601 S B St Unit 12
- 1042 San Juan St
- 165 Mountain View Dr
- 163 Mountain View Dr
- 155 Mountain View Dr
- 178 N A St
- 170 N A St
- 168 N A St
- 17400 Irvine Blvd
- 160 N A St
- 149 Mountain View Dr
- 168 Mountain View Dr
- 170 Mountain View Dr
- 160 Mountain View Dr
- 158 N A St
- 158 Mountain View Dr
- 150 N A St
- 145 Mountain View Dr
- 150 Mountain View Dr
- 143 Mountain View Dr
- 148 Mountain View Dr
- 148 N A St
Your Personal Tour Guide
Ask me questions while you tour the home.