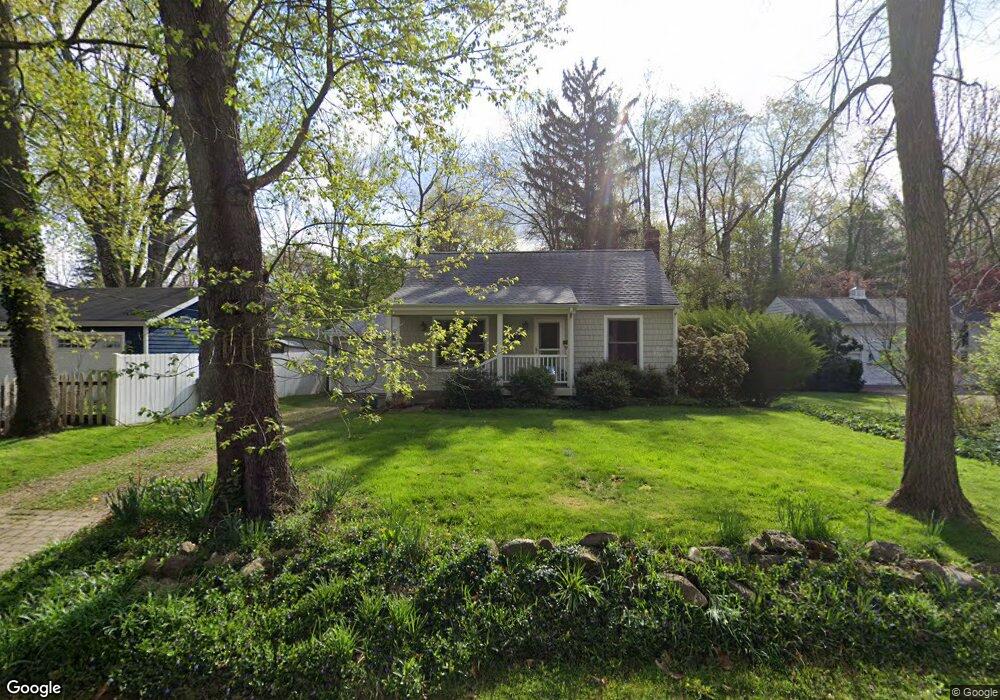
175 Robens Ct Chagrin Falls, OH 44022
Estimated Value: $428,000 - $548,000
3
Beds
3
Baths
1,726
Sq Ft
$266/Sq Ft
Est. Value
About This Home
This home is located at 175 Robens Ct, Chagrin Falls, OH 44022 and is currently estimated at $459,274, approximately $266 per square foot. 175 Robens Ct is a home located in Cuyahoga County with nearby schools including Gurney Elementary School, Chagrin Falls Intermediate Elementary School, and Chagrin Falls Middle School.
Ownership History
Date
Name
Owned For
Owner Type
Purchase Details
Closed on
Jun 1, 2018
Sold by
Bellezza Francis S and Bellezza Suzanne F
Bought by
Bellezza Suzanne F and Bellezza Revocable T Suzanne F
Current Estimated Value
Purchase Details
Closed on
Feb 23, 2007
Sold by
Long Jennifer R
Bought by
Bellezza Francis S and Bellezza Suzanne F
Home Financials for this Owner
Home Financials are based on the most recent Mortgage that was taken out on this home.
Original Mortgage
$116,000
Outstanding Balance
$67,978
Interest Rate
6.23%
Mortgage Type
Purchase Money Mortgage
Estimated Equity
$391,296
Purchase Details
Closed on
Sep 20, 1985
Sold by
Long Donald E and Long Jennifer R
Bought by
Long Jennifer R
Purchase Details
Closed on
Oct 12, 1978
Sold by
Smith Henry W and Smith Barbara E
Bought by
Henry W Smith
Purchase Details
Closed on
Jan 1, 1975
Bought by
Smith Henry W and Smith Barbara E
Create a Home Valuation Report for This Property
The Home Valuation Report is an in-depth analysis detailing your home's value as well as a comparison with similar homes in the area
Home Values in the Area
Average Home Value in this Area
Purchase History
| Date | Buyer | Sale Price | Title Company |
|---|---|---|---|
| Bellezza Suzanne F | -- | None Available | |
| Bellezza Francis S | $145,000 | Barristers Title Agency | |
| Long Jennifer R | -- | -- | |
| Long Donald E | $64,000 | -- | |
| Henry W Smith | -- | -- | |
| Smith Henry W | -- | -- |
Source: Public Records
Mortgage History
| Date | Status | Borrower | Loan Amount |
|---|---|---|---|
| Open | Bellezza Francis S | $116,000 |
Source: Public Records
Tax History
| Year | Tax Paid | Tax Assessment Tax Assessment Total Assessment is a certain percentage of the fair market value that is determined by local assessors to be the total taxable value of land and additions on the property. | Land | Improvement |
|---|---|---|---|---|
| 2025 | $6,745 | $110,635 | $26,705 | $83,930 |
| 2024 | $6,822 | $110,635 | $26,705 | $83,930 |
| 2023 | $6,604 | $92,790 | $30,490 | $62,300 |
| 2022 | $6,986 | $92,785 | $30,485 | $62,300 |
| 2021 | $6,955 | $92,790 | $30,490 | $62,300 |
| 2020 | $6,670 | $82,110 | $26,990 | $55,130 |
| 2019 | $6,569 | $234,600 | $77,100 | $157,500 |
| 2018 | $5,966 | $82,110 | $26,990 | $55,130 |
| 2017 | $6,215 | $73,920 | $22,680 | $51,240 |
| 2016 | $5,579 | $73,920 | $22,680 | $51,240 |
| 2015 | $5,163 | $73,920 | $22,680 | $51,240 |
| 2014 | $5,163 | $67,210 | $20,620 | $46,590 |
Source: Public Records
Map
Nearby Homes
- 81 Hall St
- 52 Carriage Stone Dr
- 106 Solon Rd
- 275 Solon Rd Unit 275C
- 315 Solon Rd Unit 309
- 106 W Washington St
- 318 Hillside Ln
- 207 S Main St
- 225 S Main St
- 213 S Main St
- 219 S Main St
- 40 Highland Ln
- 42 W Orange St
- 145 Greenbrier Dr
- 110 Emilia Ct
- S/L Rocker Ave
- 16690 Dayton St
- 188 Cleveland St
- 35 Skyline Dr
- 7202 Woodland Ave
Your Personal Tour Guide
Ask me questions while you tour the home.