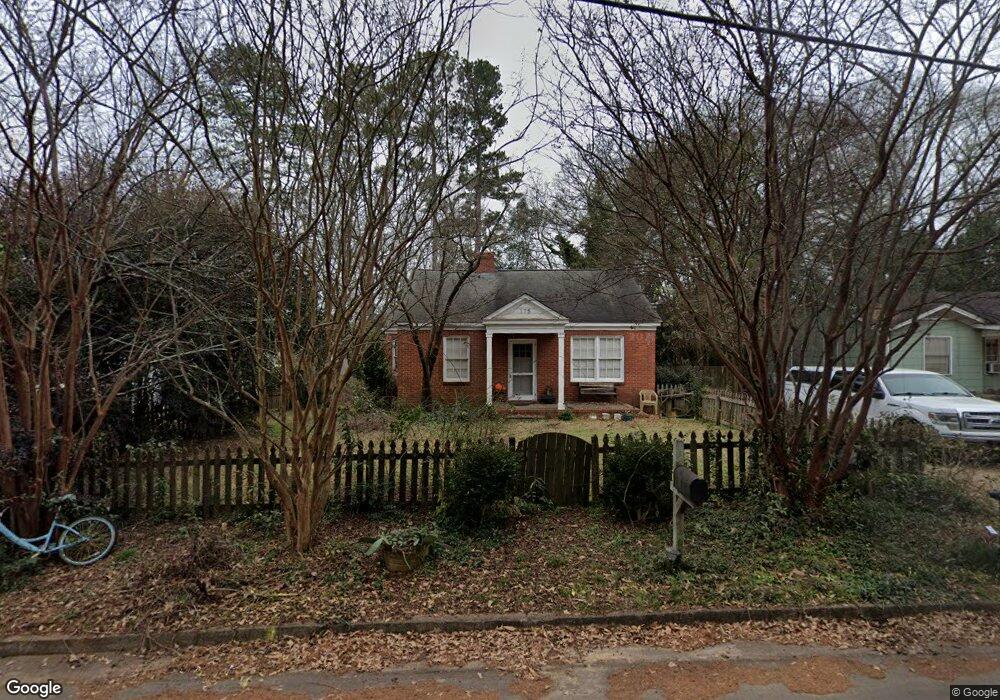
175 Windsor Ct Athens, GA 30606
Normaltown NeighborhoodEstimated Value: $320,000 - $387,000
2
Beds
1
Bath
904
Sq Ft
$395/Sq Ft
Est. Value
About This Home
This home is located at 175 Windsor Ct, Athens, GA 30606 and is currently estimated at $357,418, approximately $395 per square foot. 175 Windsor Ct is a home located in Clarke County with nearby schools including Johnnie Lay Burks Elementary School, Clarke Middle School, and Clarke Central High School.
Ownership History
Date
Name
Owned For
Owner Type
Purchase Details
Closed on
Jun 30, 2011
Sold by
Beynart Timothy
Bought by
Jones Leslie Spornberger
Current Estimated Value
Home Financials for this Owner
Home Financials are based on the most recent Mortgage that was taken out on this home.
Original Mortgage
$121,250
Outstanding Balance
$83,049
Interest Rate
4.57%
Mortgage Type
New Conventional
Estimated Equity
$274,369
Purchase Details
Closed on
Apr 20, 2005
Sold by
Waverly Court Houses Llc
Bought by
Beynart Timothy
Home Financials for this Owner
Home Financials are based on the most recent Mortgage that was taken out on this home.
Original Mortgage
$92,000
Interest Rate
5.99%
Mortgage Type
New Conventional
Purchase Details
Closed on
Aug 23, 2002
Sold by
Bondurant John P Mrs
Bought by
Waverly Court Houses Llc
Create a Home Valuation Report for This Property
The Home Valuation Report is an in-depth analysis detailing your home's value as well as a comparison with similar homes in the area
Home Values in the Area
Average Home Value in this Area
Purchase History
| Date | Buyer | Sale Price | Title Company |
|---|---|---|---|
| Jones Leslie Spornberger | $125,000 | -- | |
| Beynart Timothy | $115,000 | -- | |
| Waverly Court Houses Llc | -- | -- |
Source: Public Records
Mortgage History
| Date | Status | Borrower | Loan Amount |
|---|---|---|---|
| Open | Jones Leslie Spornberger | $121,250 | |
| Previous Owner | Beynart Timothy | $92,000 | |
| Previous Owner | Beynart Timothy | $17,250 |
Source: Public Records
Tax History
| Year | Tax Paid | Tax Assessment Tax Assessment Total Assessment is a certain percentage of the fair market value that is determined by local assessors to be the total taxable value of land and additions on the property. | Land | Improvement |
|---|---|---|---|---|
| 2025 | $3,166 | $121,643 | $44,000 | $77,643 |
| 2024 | $3,166 | $112,100 | $44,000 | $68,100 |
| 2023 | $1,837 | $93,774 | $40,000 | $53,774 |
| 2022 | $2,486 | $87,942 | $40,000 | $47,942 |
| 2021 | $2,382 | $80,686 | $40,000 | $40,686 |
| 2020 | $2,176 | $74,582 | $36,000 | $38,582 |
| 2019 | $1,882 | $65,438 | $32,000 | $33,438 |
| 2018 | $1,819 | $63,567 | $32,000 | $31,567 |
| 2017 | $1,735 | $61,112 | $32,000 | $29,112 |
| 2016 | $1,664 | $59,007 | $32,000 | $27,007 |
| 2015 | $1,531 | $55,007 | $28,000 | $27,007 |
| 2014 | $1,533 | $55,007 | $28,000 | $27,007 |
Source: Public Records
Map
Nearby Homes
- 271 King Ave
- 923 Hill St
- 189 Glenhaven Ave
- 1398 W Hancock Ave
- 1196 W Hancock Ave Unit 1
- 1198 W West Hancock Ave W
- 330 Pineneedle Rd
- 160 Miller St
- 524 Hill St
- 215 Holman Ave
- 282 Holman Ave
- 375 Best Dr
- 458 Dearing St
- 277 Evans St
- 105 Magnolia Terrace
- 570 Prince Ave
- 1759 W Hancock Ave
- 1055 Baxter St Unit 406
- 1055 Baxter St Unit 201
- 947 N Chase St
- 155 Windsor Ct
- 185 Windsor Ct
- 500 Hillcrest Ave
- 150 Windsor Ct
- 510 Hillcrest Ave
- 170 Windsor Ct
- 195 Windsor Ct
- 520 Hillcrest Ave
- 180 Windsor Ct
- 475 Hillcrest Ave
- 200 Windsor Ct
- 485 Hillcrest Ave
- 530 Hillcrest Ave
- 190 Windsor Ct
- 249 Hillcrest Ave
- 540 Hillcrest Ave
- 275 King Ave
- 279 King Ave
- 175 Waverly Ct
- 550 Hillcrest Ave
Your Personal Tour Guide
Ask me questions while you tour the home.