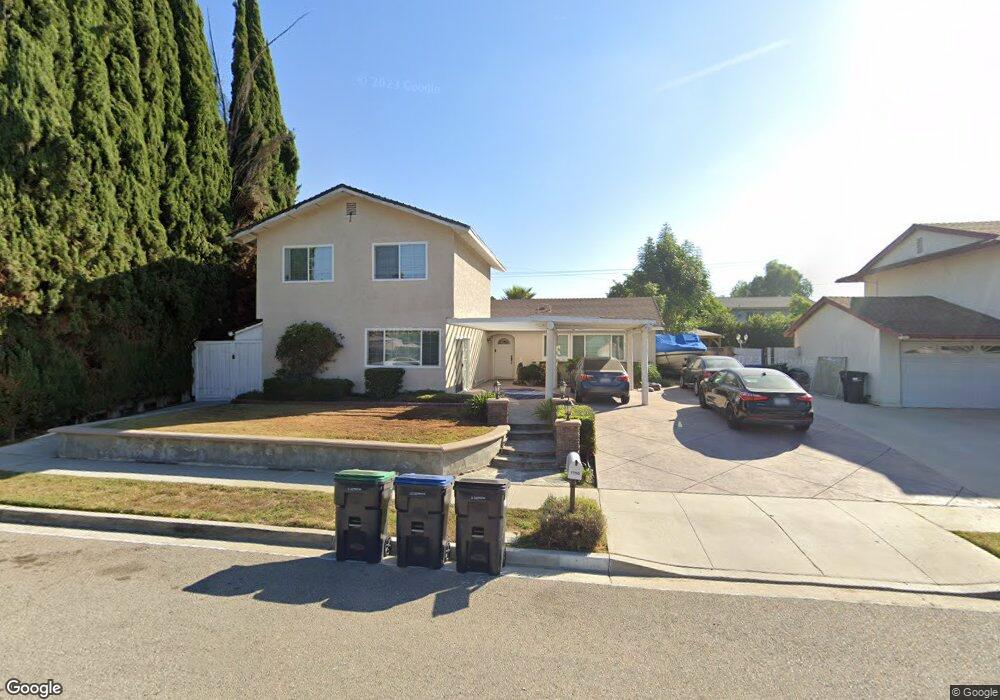
1750 Gilda Cir Simi Valley, CA 93065
Central Simi Valley NeighborhoodEstimated Value: $766,045 - $862,000
4
Beds
3
Baths
1,205
Sq Ft
$676/Sq Ft
Est. Value
About This Home
This home is located at 1750 Gilda Cir, Simi Valley, CA 93065 and is currently estimated at $815,011, approximately $676 per square foot. 1750 Gilda Cir is a home located in Ventura County with nearby schools including Berylwood Elementary School, Hillside Middle School, and Royal High School.
Ownership History
Date
Name
Owned For
Owner Type
Purchase Details
Closed on
Jun 1, 1995
Sold by
Elson Donald Lee and Elson Carol Jean
Bought by
Vanetten George Michael and Vanetten Kathi Lynn
Current Estimated Value
Home Financials for this Owner
Home Financials are based on the most recent Mortgage that was taken out on this home.
Original Mortgage
$167,770
Interest Rate
8.37%
Create a Home Valuation Report for This Property
The Home Valuation Report is an in-depth analysis detailing your home's value as well as a comparison with similar homes in the area
Home Values in the Area
Average Home Value in this Area
Purchase History
| Date | Buyer | Sale Price | Title Company |
|---|---|---|---|
| Vanetten George Michael | $176,500 | Chicago Title Company |
Source: Public Records
Mortgage History
| Date | Status | Borrower | Loan Amount |
|---|---|---|---|
| Closed | Vanetten George Michael | $167,770 |
Source: Public Records
Tax History
| Year | Tax Paid | Tax Assessment Tax Assessment Total Assessment is a certain percentage of the fair market value that is determined by local assessors to be the total taxable value of land and additions on the property. | Land | Improvement |
|---|---|---|---|---|
| 2025 | $4,028 | $301,448 | $118,570 | $182,878 |
| 2024 | $4,028 | $295,538 | $116,245 | $179,293 |
| 2023 | $3,786 | $289,744 | $113,966 | $175,778 |
| 2022 | $3,754 | $284,063 | $111,731 | $172,332 |
| 2021 | $3,711 | $278,494 | $109,541 | $168,953 |
| 2020 | $3,624 | $275,641 | $108,419 | $167,222 |
| 2019 | $3,458 | $270,238 | $106,294 | $163,944 |
| 2018 | $3,419 | $264,940 | $104,210 | $160,730 |
| 2017 | $3,335 | $259,746 | $102,167 | $157,579 |
| 2016 | $3,183 | $254,654 | $100,164 | $154,490 |
| 2015 | $3,108 | $250,830 | $98,660 | $152,170 |
| 2014 | $3,055 | $245,918 | $96,728 | $149,190 |
Source: Public Records
Map
Nearby Homes
- 1558 Ysrella Ave
- 2165 Malcolm St
- 2095 Morley St
- 2267 Morley St
- 1904 Heywood St Unit L
- 1932 Heywood St Unit B
- 2399 Lee St
- 2405 Lee St
- 2146 N Brower St
- 1843 Garvin Ave
- 1387 Cherry Ave
- 2407 Elizondo Ave
- 2091 Marter Ave
- 2025 Royal Ave
- 1805 Hillary Ct
- 1755 Heywood St Unit 201
- 2239 McDonald St
- 2371 Larch St
- 1290 Lawrence Cir
- 1763 Kearney Ave
Your Personal Tour Guide
Ask me questions while you tour the home.