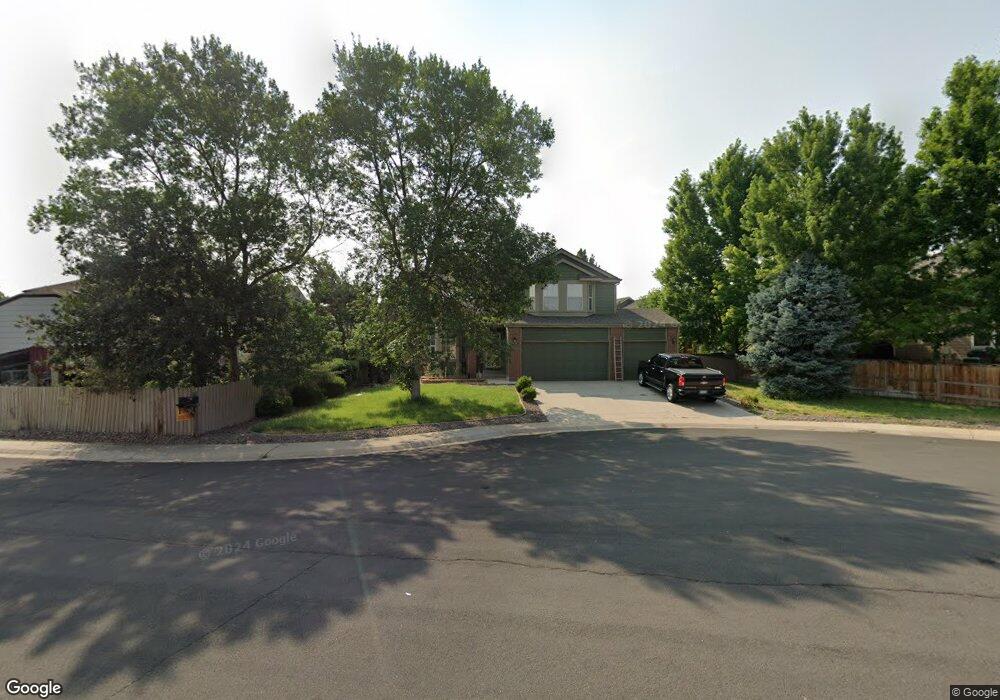
17511 Holyoke Ct Parker, CO 80134
Clarke Farms NeighborhoodEstimated Value: $577,000 - $606,000
3
Beds
4
Baths
1,778
Sq Ft
$333/Sq Ft
Est. Value
About This Home
This home is located at 17511 Holyoke Ct, Parker, CO 80134 and is currently estimated at $592,456, approximately $333 per square foot. 17511 Holyoke Ct is a home located in Douglas County with nearby schools including Cherokee Trail Elementary School, Sierra Middle School, and Chaparral High School.
Ownership History
Date
Name
Owned For
Owner Type
Purchase Details
Closed on
Jan 3, 2022
Sold by
Hatcher John H and Hatcher Aaron Wade
Bought by
Hatcher John H
Current Estimated Value
Purchase Details
Closed on
Feb 18, 2021
Sold by
Hatcher John H
Bought by
Hatcher John H and Hatcher Aaron Wade
Purchase Details
Closed on
Mar 1, 2010
Sold by
Hatcher John H and Hatcher Alison D
Bought by
Hatcher John H
Purchase Details
Closed on
May 13, 2008
Sold by
Hatcher John H
Bought by
Hatcher John H and Hatcher Alison D
Purchase Details
Closed on
Aug 9, 1993
Sold by
Richmond Homes Inc Ii
Bought by
Hatcher John H
Purchase Details
Closed on
Feb 17, 1993
Sold by
Richmond Homes Inc I
Bought by
Richmond Homes Inc Ii
Purchase Details
Closed on
Dec 28, 1989
Sold by
Yosemite Financial Inc
Bought by
Richmond American Homes Colorado Inc Ii
Purchase Details
Closed on
Sep 19, 1989
Sold by
Wood Brothers Homes Inc
Bought by
Yosemite Financial Inc
Purchase Details
Closed on
Dec 31, 1986
Sold by
Silverado Parker
Bought by
Wood Brothers Homes Inc
Create a Home Valuation Report for This Property
The Home Valuation Report is an in-depth analysis detailing your home's value as well as a comparison with similar homes in the area
Home Values in the Area
Average Home Value in this Area
Purchase History
| Date | Buyer | Sale Price | Title Company |
|---|---|---|---|
| Hatcher John H | -- | None Listed On Document | |
| Hatcher John H | -- | None Available | |
| Hatcher John H | -- | None Available | |
| Hatcher John H | -- | None Available | |
| Hatcher John H | $132,500 | -- | |
| Richmond Homes Inc Ii | -- | -- | |
| Richmond American Homes Colorado Inc Ii | -- | -- | |
| Yosemite Financial Inc | -- | -- | |
| Wood Brothers Homes Inc | $2,132,100 | -- |
Source: Public Records
Tax History Compared to Growth
Tax History
| Year | Tax Paid | Tax Assessment Tax Assessment Total Assessment is a certain percentage of the fair market value that is determined by local assessors to be the total taxable value of land and additions on the property. | Land | Improvement |
|---|---|---|---|---|
| 2024 | $3,364 | $42,190 | $9,640 | $32,550 |
| 2023 | $3,404 | $42,190 | $9,640 | $32,550 |
| 2022 | $2,550 | $29,490 | $5,680 | $23,810 |
| 2021 | $2,655 | $29,490 | $5,680 | $23,810 |
| 2020 | $2,519 | $28,450 | $5,370 | $23,080 |
| 2019 | $2,534 | $28,450 | $5,370 | $23,080 |
| 2018 | $2,157 | $23,600 | $5,220 | $18,380 |
| 2017 | $2,001 | $23,600 | $5,220 | $18,380 |
| 2016 | $1,801 | $20,850 | $4,220 | $16,630 |
| 2015 | $1,834 | $20,850 | $4,220 | $16,630 |
| 2014 | $1,723 | $17,460 | $4,220 | $13,240 |
Source: Public Records
Map
Nearby Homes
- 10318 Severance Dr
- 10505 Berthoud Way
- 17351 Cornerstone Dr
- 10607 Clarke Farms Dr
- 17235 Opal Hill Dr
- 10107 Riverstone Dr
- 17130 Opal Hill Dr
- 17071 Knollside Ave
- 17046 Wellington Dr
- 10371 Knollside Dr
- 17109 Campion Way
- 11626 Masonville Dr
- 11613 Masonville Dr
- 10414 Stonewillow Dr
- 17050 E Wiley Place
- 10787 Twenty Mile Rd Unit 305
- 10907 Baxter Dr
- 16745 Rockledge Cove
- 17033 Numa Place
- 10251 Hedge Ln
- 10301 Severance Dr
- 10303 Severance Dr
- 10271 Riverstone Dr
- 10279 Riverstone Dr
- 10305 Severance Dr
- 10265 Riverstone Dr
- 10283 Riverstone Dr
- 10259 Riverstone Dr
- 10307 Severance Dr
- 17510 Holyoke Ct
- 10289 Riverstone Dr
- 17504 Holyoke Ct
- 17506 Holyoke Ct
- 17502 Holyoke Ct
- 17508 Holyoke Ct
- 10253 Riverstone Dr
- 10542 Holyoke Dr
- 10309 Severance Dr
- 10302 Severance Dr
- 10295 Riverstone Dr