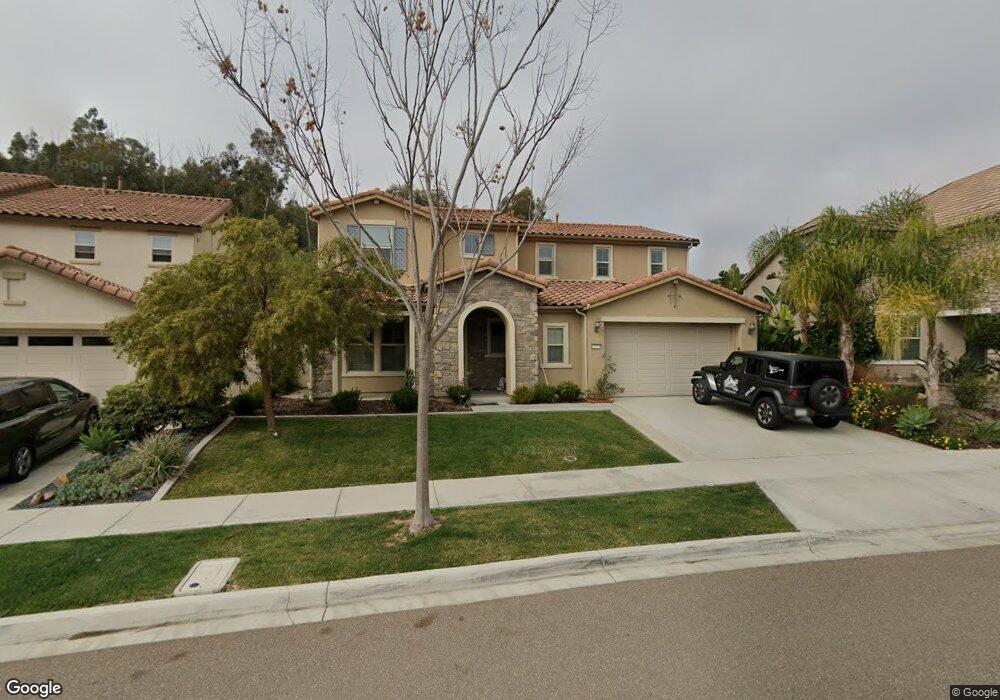
17520 Ralphs Ranch Rd San Diego, CA 92127
4S Ranch NeighborhoodEstimated Value: $2,066,196 - $2,348,000
4
Beds
4
Baths
3,000
Sq Ft
$722/Sq Ft
Est. Value
About This Home
This home is located at 17520 Ralphs Ranch Rd, San Diego, CA 92127 and is currently estimated at $2,166,549, approximately $722 per square foot. 17520 Ralphs Ranch Rd is a home with nearby schools including Monterey Ridge Elementary School, Oak Valley Middle, and Del Norte High School.
Ownership History
Date
Name
Owned For
Owner Type
Purchase Details
Closed on
Jun 29, 2023
Sold by
Weng Sean X and Weng Mengqiong
Bought by
Weng-Ran Family Trust and Weng
Current Estimated Value
Purchase Details
Closed on
Nov 10, 2014
Sold by
Weng Sean X
Bought by
Weng Sean X and Ran Mengqiong
Home Financials for this Owner
Home Financials are based on the most recent Mortgage that was taken out on this home.
Original Mortgage
$522,000
Interest Rate
2.75%
Mortgage Type
Adjustable Rate Mortgage/ARM
Purchase Details
Closed on
Oct 24, 2012
Sold by
Pulte Home Corporation
Bought by
Weng Sean X
Home Financials for this Owner
Home Financials are based on the most recent Mortgage that was taken out on this home.
Original Mortgage
$546,250
Interest Rate
3.43%
Mortgage Type
New Conventional
Purchase Details
Closed on
Mar 1, 2012
Sold by
4S Kelwood General Partnership
Bought by
Pulte Home Corporation
Create a Home Valuation Report for This Property
The Home Valuation Report is an in-depth analysis detailing your home's value as well as a comparison with similar homes in the area
Home Values in the Area
Average Home Value in this Area
Purchase History
| Date | Buyer | Sale Price | Title Company |
|---|---|---|---|
| Weng-Ran Family Trust | -- | None Listed On Document | |
| Weng Sean X | -- | Accommodation | |
| Weng Sean X | -- | Chicago Title Company | |
| Weng Sean X | $698,500 | First American Title Company | |
| Pulte Home Corporation | $8,933,000 | Chicago Title Company |
Source: Public Records
Mortgage History
| Date | Status | Borrower | Loan Amount |
|---|---|---|---|
| Previous Owner | Weng Sean X | $522,000 | |
| Previous Owner | Weng Sean X | $546,250 | |
| Closed | Pulte Home Corporation | $0 |
Source: Public Records
Tax History Compared to Growth
Tax History
| Year | Tax Paid | Tax Assessment Tax Assessment Total Assessment is a certain percentage of the fair market value that is determined by local assessors to be the total taxable value of land and additions on the property. | Land | Improvement |
|---|---|---|---|---|
| 2025 | $15,936 | $859,704 | $397,745 | $461,959 |
| 2024 | $15,936 | $842,848 | $389,947 | $452,901 |
| 2023 | $15,756 | $810,120 | $374,805 | $435,315 |
| 2022 | $15,476 | $810,120 | $374,805 | $435,315 |
| 2021 | $15,341 | $794,236 | $367,456 | $426,780 |
| 2020 | $14,874 | $786,093 | $363,689 | $422,404 |
| 2019 | $14,470 | $770,680 | $356,558 | $414,122 |
| 2018 | $14,206 | $755,569 | $349,567 | $406,002 |
| 2017 | $14,066 | $740,755 | $342,713 | $398,042 |
| 2016 | $13,635 | $726,232 | $335,994 | $390,238 |
| 2015 | $13,678 | $715,325 | $330,948 | $384,377 |
| 2014 | $13,392 | $701,314 | $324,466 | $376,848 |
Source: Public Records
Map
Nearby Homes
- 17595 Alva Rd
- 10545 Richard Rd
- 10214 Sienna Hills Dr
- 17155 Albert Ave
- 10237 Paseo de Linda
- 10518 Monterey Ridge Dr
- 10511 Monterey Ridge Dr
- 17134 Monterey Ridge Way
- 10409 Cherry Blossom Ln
- 16959 Silver Crest Dr
- 17022 Calle Trevino Unit 13
- 17071 Calle Trevino Unit 8
- 10551 Sanshey Ln Unit 132
- 17161 Alva Rd Unit 3023
- 17161 Alva Rd Unit 3125
- 17161 Alva Rd Unit 1523
- 17161 Alva Rd Unit 2512
- 17161 Alva Rd Unit 1214
- 17161 Alva Rd Unit 221
- 0 Camino Santa fe Dr Unit 21 250034399
- 17512 Ralphs Ranch Rd
- 17528 Ralphs Ranch Rd
- 17504 Ralphs Ranch Rd
- 17519 Ralphs Ranch Rd
- 17544 Ralphs Ranch Rd
- 17511 Ralphs Ranch Rd
- 17527 Ralphs Ranch Rd
- 17476 Ralphs Ranch Rd
- 17483 Ralphs Ranch Rd
- 17535 Ralphs Ranch Rd
- 17552 Ralphs Ranch Rd
- 17468 Ralphs Ranch Rd
- 17475 Ralphs Ranch Rd
- 17546 Teal Stone Ct
- 17560 Ralphs Ranch Rd
- 17543 Ralphs Ranch Rd
- 17460 Ralphs Ranch Rd
- 17554 Teal Stone Ct
- 17538 Teal Stone Ct
- 17467 Ralphs Ranch Rd