Estimated Value: $581,000 - $613,000
5
Beds
5
Baths
2,114
Sq Ft
$281/Sq Ft
Est. Value
About This Home
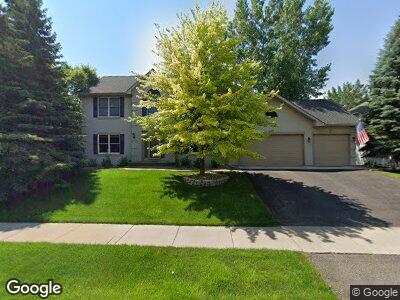
This home is located at 17521 93rd Place N, Osseo, MN 55311 and is currently estimated at $593,192, approximately $280 per square foot. 17521 93rd Place N is a home located in Hennepin County with nearby schools including Rush Creek Elementary School, Maple Grove Middle School, and Maple Grove Senior High School.
Ownership History
Date
Name
Owned For
Owner Type
Purchase Details
Closed on
May 16, 2018
Sold by
Nelson Corey and Nelson Kathryn
Bought by
Kathryn Rose Nelson Revocable Trust
Current Estimated Value
Purchase Details
Closed on
Mar 9, 2015
Sold by
Peterson Robert G and Peterson Katie R
Bought by
Nelson Corey and Nelson Kathryn
Home Financials for this Owner
Home Financials are based on the most recent Mortgage that was taken out on this home.
Original Mortgage
$378,500
Interest Rate
3.64%
Mortgage Type
New Conventional
Purchase Details
Closed on
Jul 17, 2009
Sold by
Klick Joseph R
Bought by
Peterson Robert G and Peterson Katie R
Home Financials for this Owner
Home Financials are based on the most recent Mortgage that was taken out on this home.
Original Mortgage
$363,250
Interest Rate
5%
Mortgage Type
FHA
Purchase Details
Closed on
Jun 15, 2000
Sold by
Tjb Homes Inc
Bought by
Klick Joseph R and Klick Lisa A
Purchase Details
Closed on
Jun 3, 1997
Sold by
Janco Inc
Bought by
Tjb Homes Inc
Create a Home Valuation Report for This Property
The Home Valuation Report is an in-depth analysis detailing your home's value as well as a comparison with similar homes in the area
Home Values in the Area
Average Home Value in this Area
Purchase History
| Date | Buyer | Sale Price | Title Company |
|---|---|---|---|
| Nelson Corey | $398,500 | Burnet Title | |
| Peterson Robert G | $370,000 | -- | |
| Klick Joseph R | $264,600 | -- | |
| Tjb Homes Inc | $55,000 | -- |
Source: Public Records
Mortgage History
| Date | Status | Borrower | Loan Amount |
|---|---|---|---|
| Open | Nelson Corey | $352,800 | |
| Closed | Nelson Corey | $378,500 | |
| Previous Owner | Peterson Robert G | $351,950 | |
| Previous Owner | Peterson Robert G | $363,250 |
Source: Public Records
Tax History Compared to Growth
Tax History
| Year | Tax Paid | Tax Assessment Tax Assessment Total Assessment is a certain percentage of the fair market value that is determined by local assessors to be the total taxable value of land and additions on the property. | Land | Improvement |
|---|---|---|---|---|
| 2023 | $6,908 | $574,400 | $139,300 | $435,100 |
| 2022 | $5,544 | $540,900 | $94,100 | $446,800 |
| 2021 | $5,153 | $456,800 | $76,800 | $380,000 |
| 2020 | $5,427 | $417,500 | $46,000 | $371,500 |
| 2019 | $5,544 | $417,500 | $66,000 | $351,500 |
| 2018 | $5,407 | $403,300 | $65,000 | $338,300 |
| 2017 | $5,608 | $385,000 | $71,000 | $314,000 |
| 2016 | $5,602 | $379,600 | $71,000 | $308,600 |
| 2015 | $5,577 | $368,500 | $76,000 | $292,500 |
| 2014 | -- | $338,300 | $76,000 | $262,300 |
Source: Public Records
Map
Nearby Homes
- 17520 93rd Place N
- 17606 93rd Place N
- 9349 Kimberly Ln N
- 9209 Merrimac Ln N
- 9277 Inland Ln N
- 17156 93rd Place N Unit 56
- 9640 Peony Ln N Unit 1208
- 9105 Holly Ln N
- 9063 Holly Ln N
- 9670 Merrimac Ln N
- 18061 96th Ave N
- 18049 96th Ave N
- 10154 Peony Ln N
- 10172 Peony Ln N
- 9033 Peony Ln N
- 17950 89th Place N
- 9162 Comstock Ln N
- 9179 Larkspur Glade
- 8782 Narcissus Ln N
- 9010 Comstock Ln N
- 17521 93rd Place N
- 17563 93rd Place N
- 17595 93rd Place N
- 9341 Kimberly Ln N
- 17562 93rd Place N
- 9323 Kimberly Ln N
- 9315 Kimberly Ln N
- 17627 93rd Place N
- 17584 93rd Place N
- 9307 Kimberly Ln N
- 9350 Kimberly Ln N
- 9301 Kimberly Ln N
- 9372 Kimberly Ln N
- 17649 93rd Place N
- 17638 93rd Place N
- 9404 Kimberly Ln N
- 9340 Kimberly Ln N
- 9348 Kimberly Ln N
- 9332 Kimberly Ln N
- 17440 93rd Place N