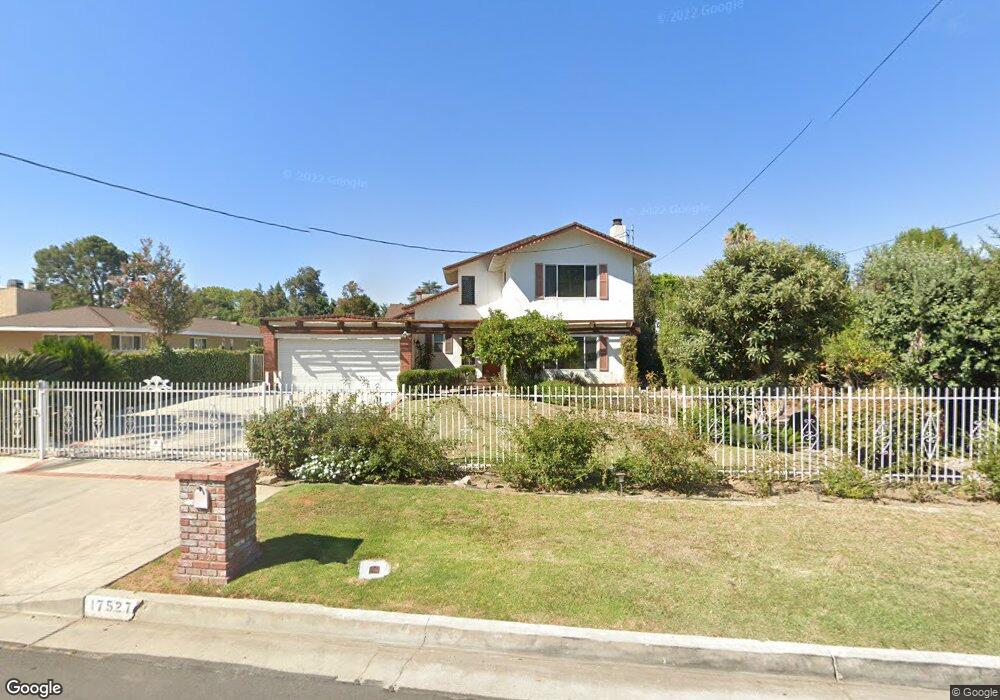
17527 Raymer St Northridge, CA 91325
Estimated Value: $1,350,973 - $1,614,000
4
Beds
4
Baths
2,722
Sq Ft
$546/Sq Ft
Est. Value
About This Home
This home is located at 17527 Raymer St, Northridge, CA 91325 and is currently estimated at $1,487,493, approximately $546 per square foot. 17527 Raymer St is a home located in Los Angeles County with nearby schools including Northridge Middle School, Northridge Academy High, and Valley Academy of Arts & Sciences.
Ownership History
Date
Name
Owned For
Owner Type
Purchase Details
Closed on
Oct 17, 2014
Sold by
Hsu Joseph Chingchung
Bought by
The Joseph & Rosaline Hsu Family Trust
Current Estimated Value
Home Financials for this Owner
Home Financials are based on the most recent Mortgage that was taken out on this home.
Original Mortgage
$417,000
Interest Rate
4.1%
Mortgage Type
New Conventional
Purchase Details
Closed on
Aug 1, 2013
Sold by
Hsu Joseph Chingchung
Bought by
Hsu Joseph Chingchung and Hsu Rosaline Hui
Purchase Details
Closed on
Jan 9, 2003
Sold by
Hsu Joseph Ching Chung and Hsu Rosaline Hui
Bought by
Hsu Joseph Ching Chung
Home Financials for this Owner
Home Financials are based on the most recent Mortgage that was taken out on this home.
Original Mortgage
$322,700
Interest Rate
5.97%
Create a Home Valuation Report for This Property
The Home Valuation Report is an in-depth analysis detailing your home's value as well as a comparison with similar homes in the area
Home Values in the Area
Average Home Value in this Area
Purchase History
| Date | Buyer | Sale Price | Title Company |
|---|---|---|---|
| The Joseph & Rosaline Hsu Family Trust | -- | None Available | |
| Hsu Joseph Chingchung | -- | Equity Title Company | |
| Hsu Joseph Chingchung | -- | None Available | |
| Hsu Joseph Ching Chung | -- | First American Title Co |
Source: Public Records
Mortgage History
| Date | Status | Borrower | Loan Amount |
|---|---|---|---|
| Closed | Hsu Joseph Chingchung | $417,000 | |
| Closed | Hsu Joseph Ching Chung | $322,700 |
Source: Public Records
Tax History Compared to Growth
Tax History
| Year | Tax Paid | Tax Assessment Tax Assessment Total Assessment is a certain percentage of the fair market value that is determined by local assessors to be the total taxable value of land and additions on the property. | Land | Improvement |
|---|---|---|---|---|
| 2025 | $8,498 | $688,989 | $249,943 | $439,046 |
| 2024 | $8,498 | $675,481 | $245,043 | $430,438 |
| 2023 | $8,338 | $662,238 | $240,239 | $421,999 |
| 2022 | $7,957 | $649,254 | $235,529 | $413,725 |
| 2021 | $7,849 | $636,524 | $230,911 | $405,613 |
| 2019 | $7,617 | $617,646 | $224,063 | $393,583 |
| 2018 | $7,465 | $605,536 | $219,670 | $385,866 |
| 2016 | $7,115 | $582,024 | $211,141 | $370,883 |
| 2015 | $7,012 | $573,282 | $207,970 | $365,312 |
| 2014 | $7,041 | $562,054 | $203,897 | $358,157 |
Source: Public Records
Map
Nearby Homes
- 17545 Parthenia St
- 17437 Chase St
- 17800 Raymer St
- 8760 White Oak Ave
- 17912 Parthenia St
- 8610 Blauvelt Place
- 17441 Rayen St
- 17151 & 17149 W Lassen St
- 17350 Osborne St
- 17190 Gresham St
- 8300 Zelzah Ave
- 8502 Newcastle Ave
- 18022 Raymer St
- 17528 Willard St
- 8503 Newcastle Ave
- 8132 White Oak Ave
- 17529 Lanark St
- 17956 Schoenborn St
- 18018 Schoenborn St
- 8944 Enfield Ave
- 17533 Raymer St Unit A
- 17519 Raymer St
- 17555 Raymer St
- 17555 Raymer Raymer St
- 17524 Napa St
- 17520 Napa St
- 8611 Encino Ave
- 8635 Encino Ave
- 17530 Napa St
- 8602 Shoshone Ave
- 17558 Napa St
- 17532 Raymer St
- 17522 Raymer St
- 17556 Napa St
- 8618 Shoshone Ave
- 17544 Raymer St
- 17471 Raymer St
- 8647 Encino Ave
- 17500 Raymer St
- 17566 Raymer St