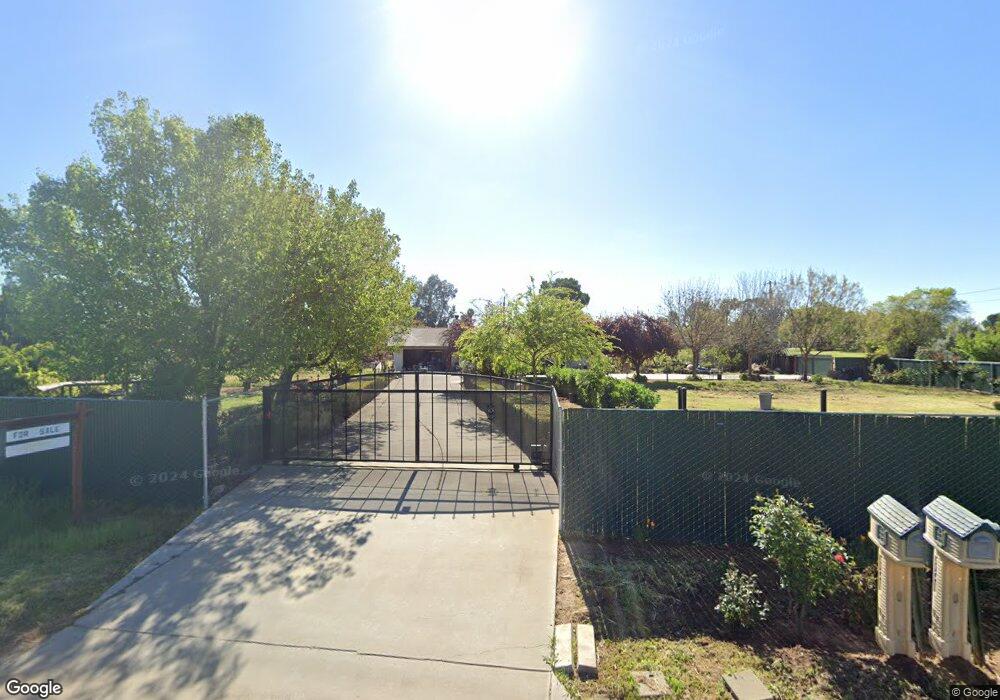
17527 Walden Dr Madera, CA 93638
Estimated Value: $390,345 - $419,000
3
Beds
2
Baths
1,439
Sq Ft
$283/Sq Ft
Est. Value
About This Home
This home is located at 17527 Walden Dr, Madera, CA 93638 and is currently estimated at $406,586, approximately $282 per square foot. 17527 Walden Dr is a home located in Madera County with nearby schools including Berenda Elementary School, Jack G. Desmond Middle School, and Madera South High School.
Ownership History
Date
Name
Owned For
Owner Type
Purchase Details
Closed on
Oct 7, 2024
Sold by
Rodriguez Agustin and Rodriguez Ricarda
Bought by
Agustin D Rodriguez Sr And Ricarda M Rodrigue and Rodriguez
Current Estimated Value
Purchase Details
Closed on
Sep 21, 2021
Sold by
Rodriguez Ricarda
Bought by
Rodriguez Ricarda and Rodriguez Cesar
Purchase Details
Closed on
Apr 30, 2002
Sold by
Koop Jake R and Koop Josie
Bought by
Rodriguez Agustin and Rodriguez Ricarda
Home Financials for this Owner
Home Financials are based on the most recent Mortgage that was taken out on this home.
Original Mortgage
$122,900
Interest Rate
6.94%
Purchase Details
Closed on
Oct 26, 2001
Sold by
Green Robert M and Green Marilyn J
Bought by
Koop Jake R and Koop Josie
Home Financials for this Owner
Home Financials are based on the most recent Mortgage that was taken out on this home.
Original Mortgage
$75,000
Interest Rate
6.84%
Create a Home Valuation Report for This Property
The Home Valuation Report is an in-depth analysis detailing your home's value as well as a comparison with similar homes in the area
Home Values in the Area
Average Home Value in this Area
Purchase History
| Date | Buyer | Sale Price | Title Company |
|---|---|---|---|
| Agustin D Rodriguez Sr And Ricarda M Rodrigue | -- | None Listed On Document | |
| Rodriguez Ricarda | -- | None Listed On Document | |
| Rodriguez Agustin | -- | None Listed On Document | |
| Rodriguez Agustin | $133,000 | First American Title Co | |
| Koop Jake R | $21,000 | Chicago Title Co |
Source: Public Records
Mortgage History
| Date | Status | Borrower | Loan Amount |
|---|---|---|---|
| Previous Owner | Rodriguez Agustin | $122,900 | |
| Previous Owner | Koop Jake R | $75,000 |
Source: Public Records
Tax History
| Year | Tax Paid | Tax Assessment Tax Assessment Total Assessment is a certain percentage of the fair market value that is determined by local assessors to be the total taxable value of land and additions on the property. | Land | Improvement |
|---|---|---|---|---|
| 2025 | $2,225 | $200,210 | $38,398 | $161,812 |
| 2023 | $2,225 | $192,438 | $36,908 | $155,530 |
| 2022 | $2,075 | $188,666 | $36,185 | $152,481 |
| 2021 | $2,035 | $184,968 | $35,476 | $149,492 |
| 2020 | $2,072 | $183,073 | $35,113 | $147,960 |
| 2019 | $2,055 | $179,484 | $34,425 | $145,059 |
| 2018 | $1,892 | $175,965 | $33,750 | $142,215 |
| 2017 | $1,868 | $172,516 | $33,089 | $139,427 |
| 2016 | $1,820 | $169,135 | $32,441 | $136,694 |
| 2015 | $1,813 | $166,595 | $31,954 | $134,641 |
| 2014 | $1,692 | $163,333 | $31,329 | $132,004 |
Source: Public Records
Map
Nearby Homes
- 0 0 Unit PW25103348
- 0 Melba Dr Unit 640499
- 17841 Rodeo Dr
- 17383 Daley Rd
- 17810 Road 26
- 26296 Dillon Way
- 16717 Hill Dr
- 25802 El Monte Way
- 26225 Avenue 17
- 0 Boles St
- 2833 Boles St
- 2801 Boles St
- 2803 Sharon Blvd
- 0 Krohn St Unit ML82030175
- 1 Krohn St
- 25540 Lynn Place Unit B
- 1 Hanover Dr
- 26041 Wayside Dr
- 282 Rosebriar St
- 264 Rosebriar St
- 17557 Walden Dr
- 17471 Circle Dr
- 17479 Walden Dr
- 17643 Brook Dr E
- 17447 Circle Dr
- 17454 Circle Dr
- 25277 Ridge Way
- 17575 Walden Dr
- 17435 Walden Dr
- 17671 Brook Dr E
- 17518 Crescent Dr
- 17668 Brook Dr E
- 17417 Circle Dr
- 17418 Circle Dr
- 17532 Crescent Dr
- 0 Ridgeway & Brook Dr
- 17498 Crescent Dr
- 25243 Ridge Way
- 17486 Crescent Dr
- 25315 Scott Way
Your Personal Tour Guide
Ask me questions while you tour the home.