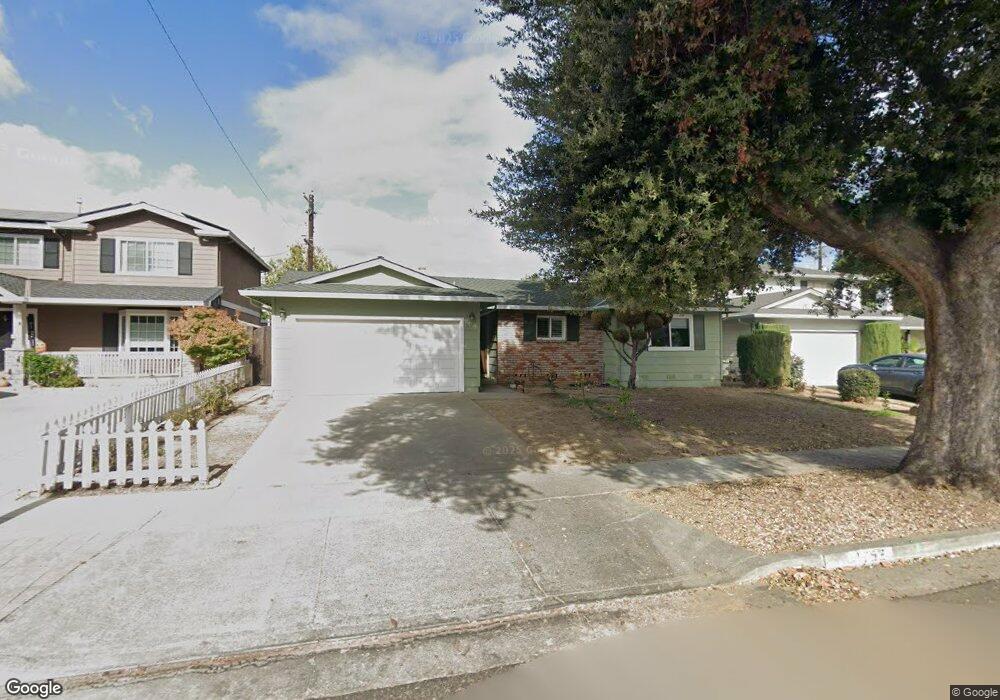
1753 El Codo Way San Jose, CA 95124
Doerr-Steindorf NeighborhoodEstimated Value: $1,826,000 - $1,944,000
4
Beds
2
Baths
1,558
Sq Ft
$1,221/Sq Ft
Est. Value
About This Home
This home is located at 1753 El Codo Way, San Jose, CA 95124 and is currently estimated at $1,902,672, approximately $1,221 per square foot. 1753 El Codo Way is a home located in Santa Clara County with nearby schools including Branham High School, Fammatre Elementary School, and Sartorette Charter School.
Ownership History
Date
Name
Owned For
Owner Type
Purchase Details
Closed on
Nov 2, 2020
Sold by
Eldridge Lisa M and Miriam L Eldridge Living Trust
Bought by
Baig Nima and Hosseinian Marva S
Current Estimated Value
Home Financials for this Owner
Home Financials are based on the most recent Mortgage that was taken out on this home.
Original Mortgage
$1,085,600
Outstanding Balance
$966,030
Interest Rate
2.8%
Mortgage Type
New Conventional
Estimated Equity
$936,642
Purchase Details
Closed on
Dec 14, 2010
Sold by
Eldridge Miriam L
Bought by
Eldridge Miriam L
Home Financials for this Owner
Home Financials are based on the most recent Mortgage that was taken out on this home.
Original Mortgage
$265,856
Interest Rate
4.35%
Mortgage Type
New Conventional
Create a Home Valuation Report for This Property
The Home Valuation Report is an in-depth analysis detailing your home's value as well as a comparison with similar homes in the area
Home Values in the Area
Average Home Value in this Area
Purchase History
| Date | Buyer | Sale Price | Title Company |
|---|---|---|---|
| Baig Nima | $1,357,000 | Old Republic Title Company | |
| Eldridge Miriam L | -- | Chicago Title Company |
Source: Public Records
Mortgage History
| Date | Status | Borrower | Loan Amount |
|---|---|---|---|
| Open | Baig Nima | $1,085,600 | |
| Previous Owner | Eldridge Miriam L | $265,856 |
Source: Public Records
Tax History
| Year | Tax Paid | Tax Assessment Tax Assessment Total Assessment is a certain percentage of the fair market value that is determined by local assessors to be the total taxable value of land and additions on the property. | Land | Improvement |
|---|---|---|---|---|
| 2025 | $19,629 | $1,468,857 | $1,248,475 | $220,382 |
| 2024 | $19,629 | $1,440,057 | $1,223,996 | $216,061 |
| 2023 | $19,510 | $1,411,822 | $1,199,997 | $211,825 |
| 2022 | $19,147 | $1,384,140 | $1,176,468 | $207,672 |
| 2021 | $18,779 | $1,357,000 | $1,153,400 | $203,600 |
| 2020 | $5,603 | $312,547 | $104,173 | $208,374 |
| 2019 | $5,043 | $306,420 | $102,131 | $204,289 |
| 2018 | $4,902 | $300,413 | $100,129 | $200,284 |
| 2017 | $4,754 | $294,523 | $98,166 | $196,357 |
| 2016 | $4,528 | $288,749 | $96,242 | $192,507 |
| 2015 | $4,465 | $284,413 | $94,797 | $189,616 |
| 2014 | $3,992 | $278,843 | $92,941 | $185,902 |
Source: Public Records
Map
Nearby Homes
- 1792 Potrero Dr
- 2643 Hill Park Dr
- 1775 Wema Way
- 1743 Willow Creek Ct
- 2872 Manda Dr
- 2823 Quinto Way
- 1695 Grizilo Dr
- 2788 Lexford Ave
- 1779 Foxworthy Ave
- 1795 Foxworthy Ave
- 2881 Meridian Ave Unit 104
- 2881 Meridian Ave Unit 234
- 2881 Meridian Ave Unit 217
- 2812 Paseo Ln Unit 2812
- 1844 Frobisher Way
- 2806 Paseo Ln
- 1763 Frobisher Way
- 2502 Meridian Ave
- 3210 Rama Dr
- 2915 Ross Ave
- 1755 El Codo Way
- 1751 El Codo Way
- 1780 Potrero Dr
- 1782 Potrero Dr
- 1757 El Codo Way
- 1778 Potrero Dr
- 1784 Potrero Dr
- 1747 El Codo Way
- 1774 Potrero Dr
- 1742 El Codo Way
- 1752 El Codo Way
- 1759 El Codo Way
- 1754 El Codo Way
- 1743 El Codo Way
- 1788 Potrero Dr
- 1772 Potrero Dr
- 1758 El Codo Way
- 1741 El Codo Way
- 1763 El Codo Way
- 2671 Hill Park Dr
Your Personal Tour Guide
Ask me questions while you tour the home.