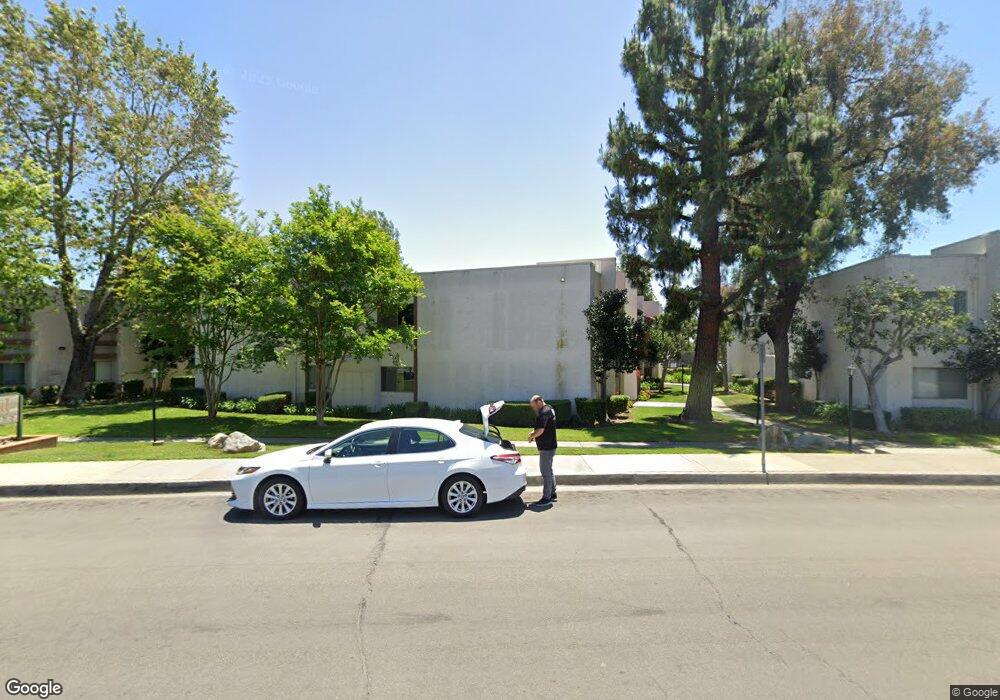
17552 Vandenberg Ln Unit 15 Tustin, CA 92780
Estimated Value: $439,000 - $537,000
1
Bed
1
Bath
753
Sq Ft
$624/Sq Ft
Est. Value
About This Home
This home is located at 17552 Vandenberg Ln Unit 15, Tustin, CA 92780 and is currently estimated at $470,132, approximately $624 per square foot. 17552 Vandenberg Ln Unit 15 is a home located in Orange County with nearby schools including Guin Foss Elementary School, Columbus Tustin Middle School, and Foothill High School.
Ownership History
Date
Name
Owned For
Owner Type
Purchase Details
Closed on
Sep 29, 1998
Sold by
Richey Deborah R and Richey Larry D
Bought by
Rogers David Allen
Current Estimated Value
Home Financials for this Owner
Home Financials are based on the most recent Mortgage that was taken out on this home.
Original Mortgage
$78,200
Outstanding Balance
$16,841
Interest Rate
6.71%
Estimated Equity
$453,291
Purchase Details
Closed on
Jan 4, 1996
Sold by
Newman Leonard and Newman Faith
Bought by
Richey Larry D and Richey Deborah R
Purchase Details
Closed on
Feb 7, 1994
Sold by
Newman Leonard and Newman Faith
Bought by
Newman Leonard and Newman Faith
Home Financials for this Owner
Home Financials are based on the most recent Mortgage that was taken out on this home.
Original Mortgage
$51,300
Interest Rate
7.1%
Create a Home Valuation Report for This Property
The Home Valuation Report is an in-depth analysis detailing your home's value as well as a comparison with similar homes in the area
Home Values in the Area
Average Home Value in this Area
Purchase History
| Date | Buyer | Sale Price | Title Company |
|---|---|---|---|
| Rogers David Allen | $84,500 | First American Title Ins Co | |
| Richey Larry D | -- | -- | |
| Newman Leonard | -- | First American Title |
Source: Public Records
Mortgage History
| Date | Status | Borrower | Loan Amount |
|---|---|---|---|
| Open | Rogers David Allen | $78,200 | |
| Previous Owner | Newman Leonard | $51,300 |
Source: Public Records
Tax History Compared to Growth
Tax History
| Year | Tax Paid | Tax Assessment Tax Assessment Total Assessment is a certain percentage of the fair market value that is determined by local assessors to be the total taxable value of land and additions on the property. | Land | Improvement |
|---|---|---|---|---|
| 2025 | $1,830 | $132,455 | $46,517 | $85,938 |
| 2024 | $1,830 | $129,858 | $45,605 | $84,253 |
| 2023 | $1,773 | $127,312 | $44,711 | $82,601 |
| 2022 | $1,731 | $124,816 | $43,834 | $80,982 |
| 2021 | $1,699 | $122,369 | $42,974 | $79,395 |
| 2020 | $1,689 | $121,115 | $42,534 | $78,581 |
| 2019 | $1,655 | $118,741 | $41,700 | $77,041 |
| 2018 | $1,629 | $116,413 | $40,882 | $75,531 |
| 2017 | $1,602 | $114,131 | $40,081 | $74,050 |
| 2016 | $1,576 | $111,894 | $39,295 | $72,599 |
| 2015 | $1,668 | $110,214 | $38,705 | $71,509 |
| 2014 | $1,630 | $108,056 | $37,947 | $70,109 |
Source: Public Records
Map
Nearby Homes
- 17522 Vandenberg Ln Unit 3
- 17516 Via Calma Unit 39
- 14272 Acacia Dr
- 13902 Yorba St Unit 14A
- 17562 Laurie Ln
- 13822 Deodar St
- 17841 Lucero Way
- 13662 Loretta Dr
- 2221 E Lenita Ln
- 18021 Bryce Place
- 2021 Kristi Ln
- 139 Jessup Way
- 282 Prospect Park
- 14141 Clarissa Ln
- 1345 Cabrillo Unit J11
- 1345 Cabrillo Park Dr Unit R02
- 1345 Cabrillo Park Dr Unit L16
- 1345 Cabrillo Park Dr Unit B02
- 1345 Cabrillo Park Dr Unit C01
- 1345 Cabrillo Park Dr Unit E01
- 17552 Vandenberg Ln Unit 1
- 17552 Vandenberg Ln Unit 4
- 17552 Vandenberg Ln Unit 13
- 17552 Vandenberg Ln Unit 10
- 17552 Vandenberg Ln Unit 14
- 17552 Vandenberg Ln Unit 16
- 17552 Vandenberg Ln Unit 11
- 17552 Vandenberg Ln Unit 12
- 17552 Vandenberg Ln Unit 6
- 17552 Vandenberg Ln Unit 5
- 17552 Vandenberg Ln Unit 9
- 17552 Vandenberg Ln Unit 2
- 17552 Vandenberg Ln Unit 8
- 17552 Vandenberg Ln Unit 3
- 17552 Vandenberg Ln Unit 7
- 17522 Vandenberg Ln Unit 10
- 17522 Vandenberg Ln Unit 12
- 17522 Vandenberg Ln Unit 5
- 17522 Vandenberg Ln Unit 7
- 17522 Vandenberg Ln Unit 13