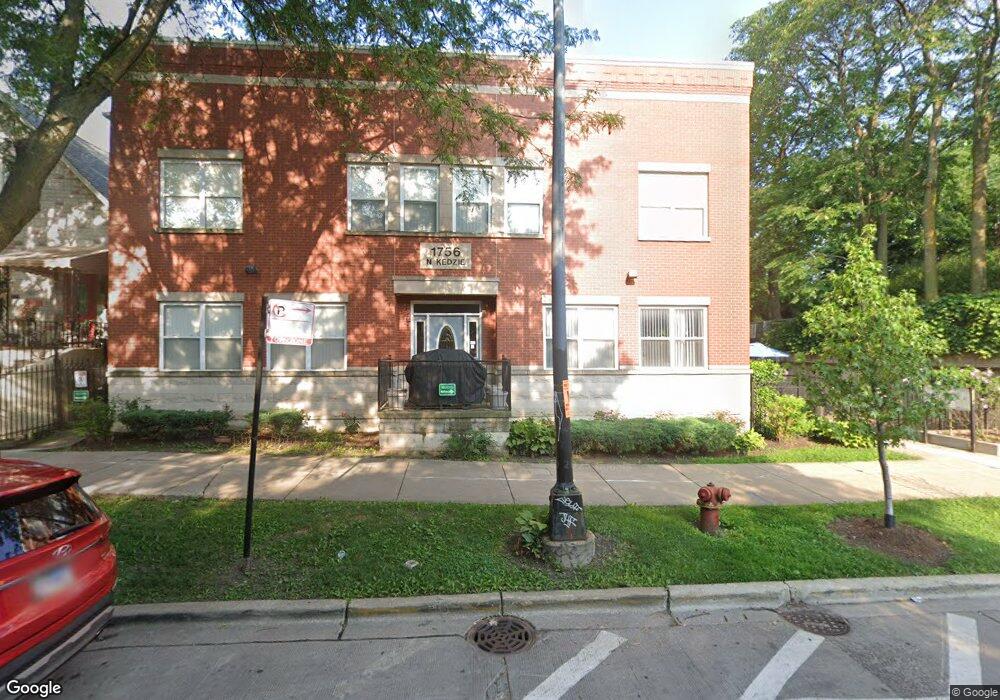
1756 N Kedzie Ave Unit G Chicago, IL 60647
Humboldt Park NeighborhoodEstimated Value: $185,478 - $396,000
--
Bed
--
Bath
17,242
Sq Ft
$19/Sq Ft
Est. Value
About This Home
This home is located at 1756 N Kedzie Ave Unit G, Chicago, IL 60647 and is currently estimated at $325,493, approximately $18 per square foot. 1756 N Kedzie Ave Unit G is a home located in Cook County with nearby schools including Stowe Elementary School, Clemente Community Academy High School, and Maternity of the Blessed Virgin Mary Elementary School.
Ownership History
Date
Name
Owned For
Owner Type
Purchase Details
Closed on
Feb 6, 2006
Sold by
Hispanic Housing Development Corp
Bought by
Felix Johnson Juanita
Current Estimated Value
Home Financials for this Owner
Home Financials are based on the most recent Mortgage that was taken out on this home.
Original Mortgage
$40,000
Outstanding Balance
$22,518
Interest Rate
6.2%
Mortgage Type
Stand Alone Second
Estimated Equity
$302,975
Purchase Details
Closed on
May 18, 2005
Sold by
Victor C Neumann Foundation
Bought by
Hispanic Housing Development Corp
Home Financials for this Owner
Home Financials are based on the most recent Mortgage that was taken out on this home.
Original Mortgage
$1,264,000
Interest Rate
6.05%
Mortgage Type
Construction
Create a Home Valuation Report for This Property
The Home Valuation Report is an in-depth analysis detailing your home's value as well as a comparison with similar homes in the area
Home Values in the Area
Average Home Value in this Area
Purchase History
| Date | Buyer | Sale Price | Title Company |
|---|---|---|---|
| Felix Johnson Juanita | $180,000 | None Available | |
| Hispanic Housing Development Corp | -- | Cti |
Source: Public Records
Mortgage History
| Date | Status | Borrower | Loan Amount |
|---|---|---|---|
| Open | Felix Johnson Juanita | $40,000 | |
| Previous Owner | Hispanic Housing Development Corp | $1,264,000 | |
| Closed | Hispanic Housing Development Corp | $115,875 |
Source: Public Records
Tax History Compared to Growth
Tax History
| Year | Tax Paid | Tax Assessment Tax Assessment Total Assessment is a certain percentage of the fair market value that is determined by local assessors to be the total taxable value of land and additions on the property. | Land | Improvement |
|---|---|---|---|---|
| 2024 | $357 | $4,750 | $1,872 | $2,878 |
| 2023 | $325 | $5,000 | $1,005 | $3,995 |
| 2022 | $325 | $5,000 | $1,005 | $3,995 |
| 2021 | $336 | $5,000 | $1,005 | $3,995 |
| 2020 | $166 | $3,848 | $485 | $3,363 |
| 2019 | $185 | $4,351 | $485 | $3,866 |
| 2018 | $181 | $4,351 | $485 | $3,866 |
| 2017 | $175 | $4,186 | $435 | $3,751 |
| 2016 | $338 | $4,186 | $435 | $3,751 |
| 2015 | $286 | $4,186 | $435 | $3,751 |
| 2014 | $793 | $6,842 | $402 | $6,440 |
| 2013 | $766 | $6,842 | $402 | $6,440 |
Source: Public Records
Map
Nearby Homes
- 1814 N Sawyer Ave
- 1837 N Albany Ave
- 1918 N Kedzie Ave
- 1902 N Albany Ave
- 1928 N Kedzie Ave Unit 403
- 1928 N Kedzie Ave Unit 306
- 1747 N Spaulding Ave
- 1926 N Sawyer Ave
- 1939 N Sawyer Ave Unit G
- 1816 N Spaulding Ave Unit 8
- 3265 W Armitage Ave
- 1714 N Spaulding Ave Unit Garage
- 1739 N Whipple St Unit 1
- 1943 N Whipple St
- 3060 W Armitage Ave
- 1918 N Humboldt Blvd
- 1949 N Whipple St Unit 1
- 3021 W Armitage Ave Unit 404
- 1922 N Humboldt Blvd
- 2025 N Sawyer Ave
- 1756 N Kedzie Ave Unit F
- 1756 N Kedzie Ave Unit E
- 1756 N Kedzie Ave Unit D
- 1756 N Kedzie Ave Unit C
- 1756 N Kedzie Ave Unit B
- 1756 N Kedzie Ave Unit A
- 1750 N Kedzie Ave
- 1746 N Kedzie Ave
- 1746 N Kedzie Ave Unit 2
- 1746 N Kedzie Ave Unit 1
- 1744 N Kedzie Ave
- 1744 N Kedzie Ave
- 1804 N Kedzie Ave
- 1742 N Kedzie Ave Unit 1
- 1740 N Kedzie Ave
- 1740 N Kedzie Ave Unit 7403
- 1740 N Kedzie Ave Unit 7402
- 1755 N Sawyer Ave Unit 3
- 1755 N Sawyer Ave Unit 2
- 1755 N Sawyer Ave Unit 3