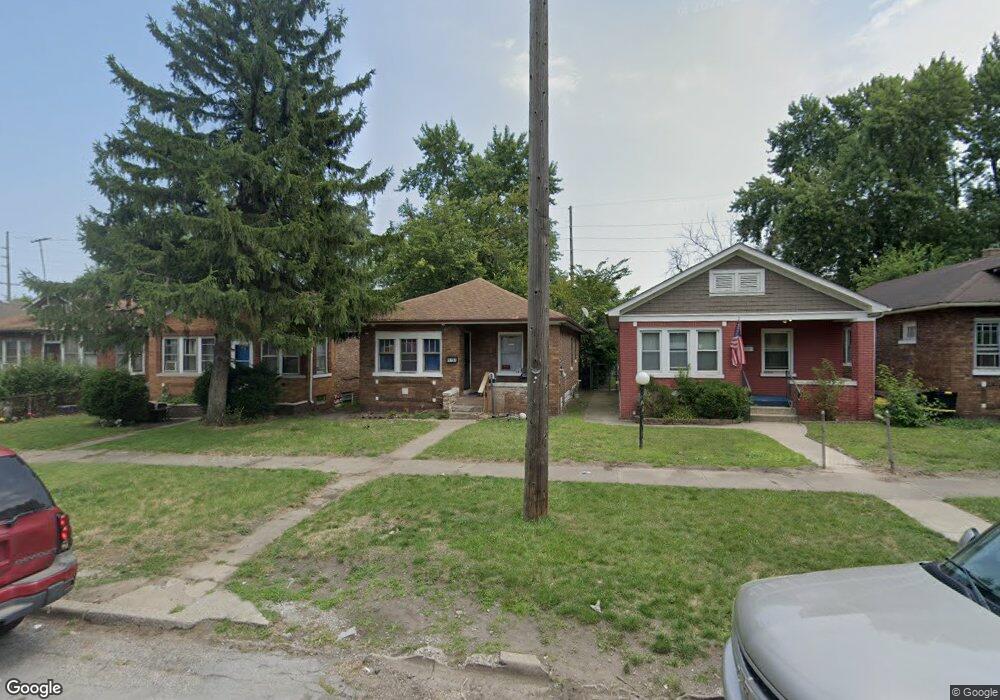
1757 Hayes St Gary, IN 46404
Tolleston NeighborhoodEstimated Value: $78,000 - $166,000
3
Beds
1
Bath
923
Sq Ft
$128/Sq Ft
Est. Value
About This Home
This home is located at 1757 Hayes St, Gary, IN 46404 and is currently estimated at $117,963, approximately $127 per square foot. 1757 Hayes St is a home located in Lake County with nearby schools including Beveridge Elementary School, Bailly Preparatory Academy, and West Side Leadership Academy.
Ownership History
Date
Name
Owned For
Owner Type
Purchase Details
Closed on
Aug 23, 2013
Sold by
Al-Da Re Ivv Llc
Bought by
Kad Real Estate Llc
Current Estimated Value
Purchase Details
Closed on
Aug 22, 2012
Sold by
Barnhart Dan and Barnhart Gayle
Bought by
Al Da Re Ivv Llc
Purchase Details
Closed on
May 8, 2012
Sold by
Mosley Bennie
Bought by
Barnhart Dan and Barnhart Gayle
Purchase Details
Closed on
Aug 12, 2005
Sold by
Heritage Construction Ltd
Bought by
Mosley Bennie
Home Financials for this Owner
Home Financials are based on the most recent Mortgage that was taken out on this home.
Original Mortgage
$67,410
Interest Rate
8.1%
Mortgage Type
Fannie Mae Freddie Mac
Purchase Details
Closed on
Mar 29, 2005
Sold by
Argent Mortgage Co Llc
Bought by
Heritage Construction Ltd
Purchase Details
Closed on
Jan 7, 2005
Sold by
Johnson Alfred and Gary Housing Authority
Bought by
Argent Mortgage Co Llc
Create a Home Valuation Report for This Property
The Home Valuation Report is an in-depth analysis detailing your home's value as well as a comparison with similar homes in the area
Home Values in the Area
Average Home Value in this Area
Purchase History
| Date | Buyer | Sale Price | Title Company |
|---|---|---|---|
| Kad Real Estate Llc | -- | None Available | |
| Al Da Re Ivv Llc | -- | None Available | |
| Barnhart Dan | -- | None Available | |
| Mosley Bennie | -- | -- | |
| Heritage Construction Ltd | -- | Kings Title & Closing | |
| Argent Mortgage Co Llc | $56,026 | -- |
Source: Public Records
Mortgage History
| Date | Status | Borrower | Loan Amount |
|---|---|---|---|
| Previous Owner | Mosley Bennie | $67,410 |
Source: Public Records
Tax History Compared to Growth
Tax History
| Year | Tax Paid | Tax Assessment Tax Assessment Total Assessment is a certain percentage of the fair market value that is determined by local assessors to be the total taxable value of land and additions on the property. | Land | Improvement |
|---|---|---|---|---|
| 2024 | $4,417 | $51,800 | $5,800 | $46,000 |
| 2023 | $976 | $50,100 | $5,100 | $45,000 |
| 2022 | $976 | $38,100 | $3,200 | $34,900 |
| 2021 | $976 | $38,100 | $3,200 | $34,900 |
| 2020 | $976 | $38,100 | $3,200 | $34,900 |
| 2019 | $822 | $38,100 | $3,200 | $34,900 |
| 2018 | $868 | $48,000 | $3,200 | $44,800 |
| 2017 | $1,113 | $48,700 | $3,200 | $45,500 |
| 2016 | $1,145 | $50,900 | $3,200 | $47,700 |
| 2014 | $1,346 | $57,500 | $3,300 | $54,200 |
| 2013 | $562 | $25,000 | $3,400 | $21,600 |
Source: Public Records
Map
Nearby Homes
- 1752 Hayes St
- 1736 Arthur St
- 1297 W 17th Ave
- 1418 W 16th Ave
- 1241 W 17th Ave
- 2261 Arthur St
- 1701 Mckinley St
- 1356 Johnson St
- 1931 W 14th Ave
- 1948 Mckinley St
- 1014 W 19th Ave
- 1690 W 12th Ave
- 1920 Roosevelt Place
- 1123 Garfield St
- 2148 Cleveland St
- 2257 W 16th Ave
- 1209 W 21st Ave
- 1201 W 21st Ave
- 1379 Roosevelt Place
- 1273 - 1277 W 17th Ave