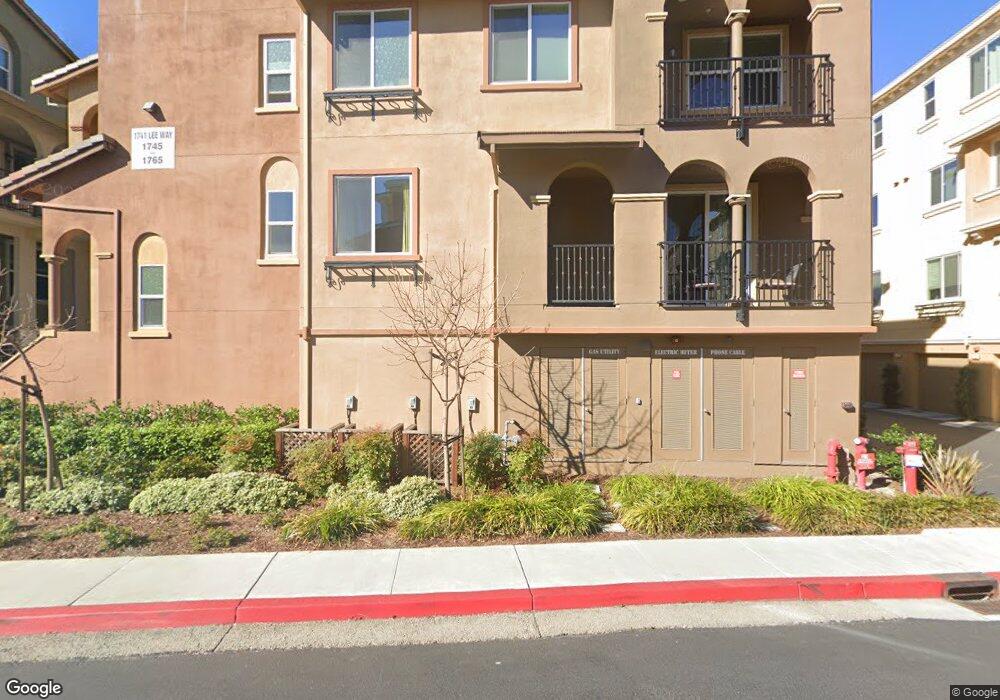
1757 Lee Way Milpitas, CA 95035
Estimated Value: $1,108,017 - $1,212,000
3
Beds
3
Baths
1,512
Sq Ft
$771/Sq Ft
Est. Value
About This Home
This home is located at 1757 Lee Way, Milpitas, CA 95035 and is currently estimated at $1,165,004, approximately $770 per square foot. 1757 Lee Way is a home located in Santa Clara County with nearby schools including Mabel Mattos Elementary School, Alexander Rose Elementary School, and Rancho Milpitas Middle School.
Ownership History
Date
Name
Owned For
Owner Type
Purchase Details
Closed on
Sep 10, 2013
Sold by
Dr Horton Bay Inc
Bought by
Ramaiah Jayaraman Janakiraman and Ramaiah Seetharaman Shyamali
Current Estimated Value
Home Financials for this Owner
Home Financials are based on the most recent Mortgage that was taken out on this home.
Original Mortgage
$431,808
Outstanding Balance
$321,718
Interest Rate
4.36%
Mortgage Type
New Conventional
Estimated Equity
$843,286
Create a Home Valuation Report for This Property
The Home Valuation Report is an in-depth analysis detailing your home's value as well as a comparison with similar homes in the area
Home Values in the Area
Average Home Value in this Area
Purchase History
| Date | Buyer | Sale Price | Title Company |
|---|---|---|---|
| Ramaiah Jayaraman Janakiraman | $540,000 | First American Title Company |
Source: Public Records
Mortgage History
| Date | Status | Borrower | Loan Amount |
|---|---|---|---|
| Open | Ramaiah Jayaraman Janakiraman | $431,808 |
Source: Public Records
Tax History
| Year | Tax Paid | Tax Assessment Tax Assessment Total Assessment is a certain percentage of the fair market value that is determined by local assessors to be the total taxable value of land and additions on the property. | Land | Improvement |
|---|---|---|---|---|
| 2025 | $8,463 | $661,661 | $330,830 | $330,831 |
| 2024 | $8,463 | $648,689 | $324,344 | $324,345 |
| 2023 | $8,414 | $635,971 | $317,985 | $317,986 |
| 2022 | $8,256 | $623,501 | $311,750 | $311,751 |
| 2021 | $8,111 | $611,277 | $305,638 | $305,639 |
| 2020 | $7,968 | $605,011 | $302,505 | $302,506 |
| 2019 | $7,864 | $593,149 | $296,574 | $296,575 |
| 2018 | $7,476 | $581,519 | $290,759 | $290,760 |
| 2017 | $7,374 | $570,117 | $285,058 | $285,059 |
| 2016 | $7,078 | $558,939 | $279,469 | $279,470 |
| 2015 | $6,995 | $550,545 | $275,272 | $275,273 |
| 2014 | $6,796 | $539,761 | $269,880 | $269,881 |
Source: Public Records
Map
Nearby Homes
- 27 S Main St
- 225 Houret Dr
- 1732 Houret Ct
- 1758 Juliet Ct
- 1761 Capulet Dr
- 1755 Capulet Dr
- 1753 Capulet Dr
- 1607 Centre Pointe Dr
- 289 Odyssey Ln
- 430 Montague Expy Unit 20
- 330 Riesling Ave Unit 23
- 460 Montague Expy Unit 40
- 1625 Delano St Unit 23
- 390 Riesling Ave Unit 21
- 380 Riesling Ave Unit 21
- 1916 Trento Loop
- 370 Riesling Ave Unit 20
- 1855 Trento Loop
- 1989 Trento Loop
- 1898 Journey St
Your Personal Tour Guide
Ask me questions while you tour the home.