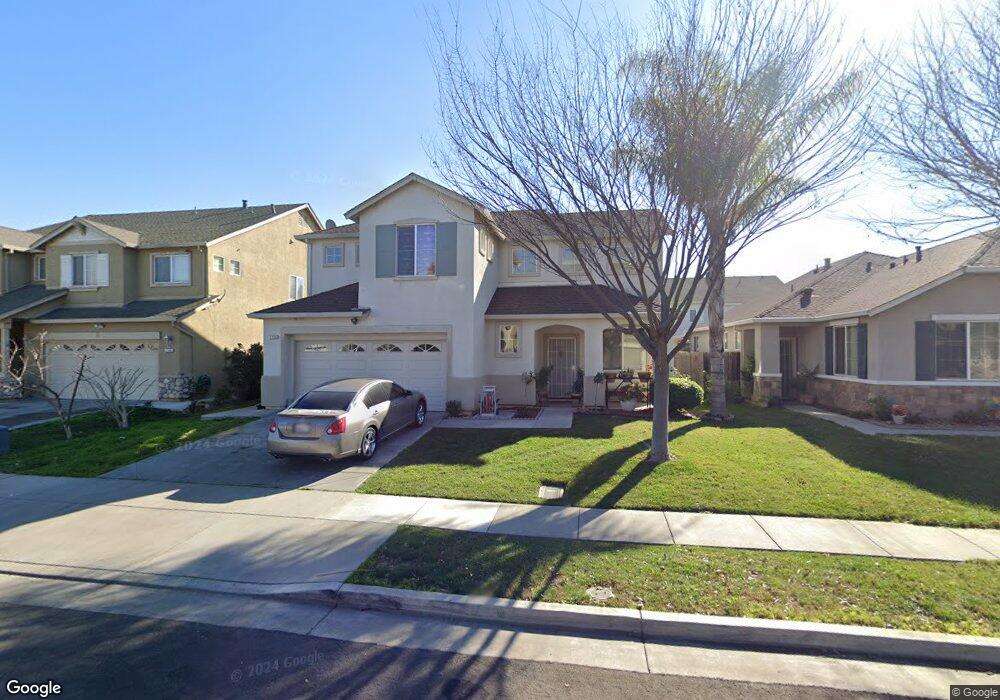
1758 Fontanella Way Stockton, CA 95205
Midtown NeighborhoodEstimated Value: $137,000 - $515,000
3
Beds
2
Baths
1,554
Sq Ft
$250/Sq Ft
Est. Value
About This Home
This home is located at 1758 Fontanella Way, Stockton, CA 95205 and is currently estimated at $388,727, approximately $250 per square foot. 1758 Fontanella Way is a home located in San Joaquin County with nearby schools including Harrison Elementary School, Grunsky Elementary School, and August Elementary School.
Ownership History
Date
Name
Owned For
Owner Type
Purchase Details
Closed on
May 1, 2009
Sold by
Us Bank National Association
Bought by
Cuna Irineo R and Romero Maria C
Current Estimated Value
Home Financials for this Owner
Home Financials are based on the most recent Mortgage that was taken out on this home.
Original Mortgage
$127,645
Outstanding Balance
$80,519
Interest Rate
4.82%
Mortgage Type
FHA
Estimated Equity
$308,208
Purchase Details
Closed on
Sep 16, 2008
Sold by
Wilson Adija
Bought by
Us Bank Na
Purchase Details
Closed on
Dec 21, 2005
Sold by
Stockton Montego Lp
Bought by
Wilson Adija
Home Financials for this Owner
Home Financials are based on the most recent Mortgage that was taken out on this home.
Original Mortgage
$298,336
Interest Rate
5.75%
Mortgage Type
Purchase Money Mortgage
Create a Home Valuation Report for This Property
The Home Valuation Report is an in-depth analysis detailing your home's value as well as a comparison with similar homes in the area
Home Values in the Area
Average Home Value in this Area
Purchase History
| Date | Buyer | Sale Price | Title Company |
|---|---|---|---|
| Cuna Irineo R | $130,000 | Orange Coast Title | |
| Us Bank Na | $109,850 | Accommodation | |
| Wilson Adija | $373,000 | Old Republic Title Co |
Source: Public Records
Mortgage History
| Date | Status | Borrower | Loan Amount |
|---|---|---|---|
| Open | Cuna Irineo R | $127,645 | |
| Previous Owner | Wilson Adija | $298,336 |
Source: Public Records
Tax History Compared to Growth
Tax History
| Year | Tax Paid | Tax Assessment Tax Assessment Total Assessment is a certain percentage of the fair market value that is determined by local assessors to be the total taxable value of land and additions on the property. | Land | Improvement |
|---|---|---|---|---|
| 2025 | $2,204 | $167,395 | $41,203 | $126,192 |
| 2024 | $2,076 | $164,114 | $40,396 | $123,718 |
| 2023 | $2,028 | $160,897 | $39,604 | $121,293 |
| 2022 | $1,988 | $157,743 | $38,828 | $118,915 |
| 2021 | $1,910 | $154,651 | $38,067 | $116,584 |
| 2020 | $1,947 | $153,066 | $37,677 | $115,389 |
| 2019 | $1,939 | $150,066 | $36,939 | $113,127 |
| 2018 | $1,905 | $147,124 | $36,215 | $110,909 |
| 2017 | $1,806 | $144,240 | $35,505 | $108,735 |
| 2016 | $1,894 | $141,412 | $34,809 | $106,603 |
| 2014 | $1,805 | $136,562 | $33,615 | $102,947 |
Source: Public Records
Map
Nearby Homes
- 1771 Fontanella Way
- 3605 Gloria Ct
- 3515 Carly Dr
- 3704 San Rafael Ave
- 2036 Mighty Oak Dr
- 4028 Trieste Cir
- 2224 Big Oak Ct
- 3537 West Ln
- 3611 West Ln
- 2312 E Stadium Dr
- 3540 San Mateo Ave
- 2337 E Alpine Ave
- 2347 E Alpine Ave
- 2340 Sanguinetti Ln Unit 54
- 2340 Sanguinetti Ln Unit 109
- 4503 White Forge Dr
- 4437 Harmony Hill Way
- 2330 Pinetown St
- 2525 Vail Ave
- 4233 Verdant St
- 1766 Fontanella Way
- 1750 Fontanella Way
- 1781 Torino Dr
- 1774 Fontanella Way
- 1742 Fontanella Way
- 1793 Torino Dr
- 1769 Torino Dr
- 1805 Torino Dr
- 1757 Torino Dr
- 1763 Fontanella Way
- 1755 Fontanella Way
- 1782 Fontanella Way
- 1734 Fontanella Way
- 1747 Fontanella Way
- 1819 Torino Dr
- 1745 Torino Dr
- 1779 Fontanella Way
- 1739 Fontanella Way
- 1726 Fontanella Way
- 1810 Fontanella Way