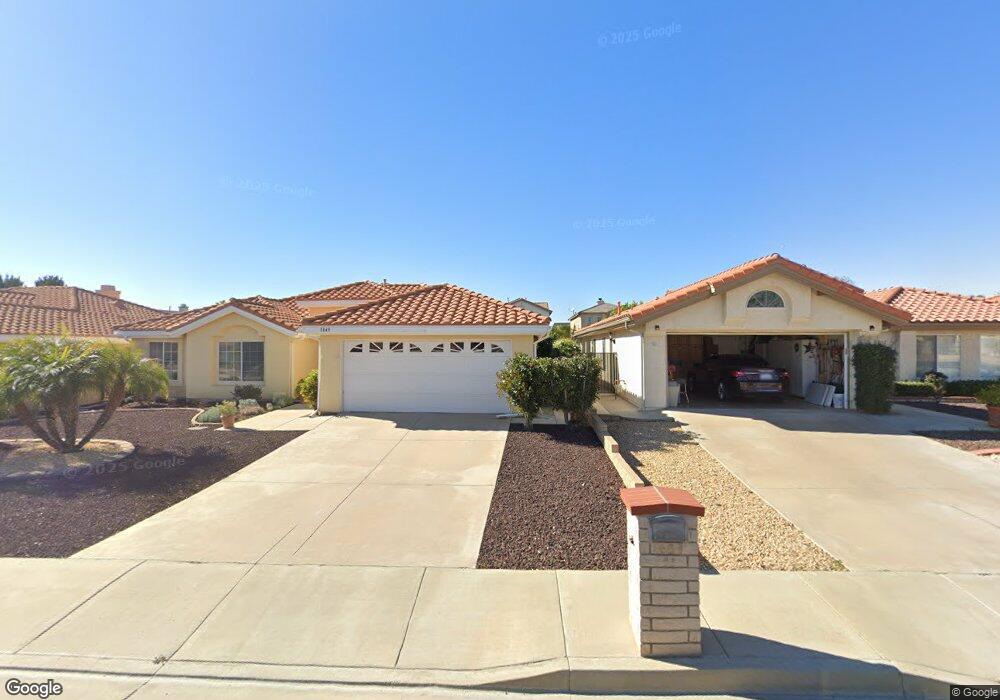
1759 Cross Gateway St Hemet, CA 92545
Page Ranch NeighborhoodEstimated Value: $508,836 - $573,000
5
Beds
4
Baths
3,105
Sq Ft
$171/Sq Ft
Est. Value
About This Home
This home is located at 1759 Cross Gateway St, Hemet, CA 92545 and is currently estimated at $530,459, approximately $170 per square foot. 1759 Cross Gateway St is a home located in Riverside County with nearby schools including Winchester Elementary School, Diamond Valley Middle School, and West Valley High School.
Ownership History
Date
Name
Owned For
Owner Type
Purchase Details
Closed on
Dec 11, 2020
Sold by
Obmina Paul Luther C and Obmina Carolina A
Bought by
Obmina Paul Luther C and Obmina Carolina A
Current Estimated Value
Purchase Details
Closed on
Oct 12, 2009
Sold by
Rivera Cynthia D and Rivera Wili
Bought by
Obmina Paul Luther C and Obmina Carolina A
Home Financials for this Owner
Home Financials are based on the most recent Mortgage that was taken out on this home.
Original Mortgage
$159,065
Outstanding Balance
$102,534
Interest Rate
4.83%
Mortgage Type
FHA
Estimated Equity
$427,925
Purchase Details
Closed on
Mar 10, 2006
Sold by
Continental Residential Inc
Bought by
Rivera Wili and Rivera Cynthia D
Home Financials for this Owner
Home Financials are based on the most recent Mortgage that was taken out on this home.
Original Mortgage
$37,499
Interest Rate
6.29%
Mortgage Type
Stand Alone Second
Create a Home Valuation Report for This Property
The Home Valuation Report is an in-depth analysis detailing your home's value as well as a comparison with similar homes in the area
Home Values in the Area
Average Home Value in this Area
Purchase History
| Date | Buyer | Sale Price | Title Company |
|---|---|---|---|
| Obmina Paul Luther C | -- | None Available | |
| Obmina Paul Luther C | $162,000 | Lawyers Title Insurance Co | |
| Rivera Wili | $375,000 | First American Title Ins Co |
Source: Public Records
Mortgage History
| Date | Status | Borrower | Loan Amount |
|---|---|---|---|
| Open | Obmina Paul Luther C | $159,065 | |
| Previous Owner | Rivera Wili | $37,499 | |
| Previous Owner | Rivera Wili | $299,992 |
Source: Public Records
Tax History Compared to Growth
Tax History
| Year | Tax Paid | Tax Assessment Tax Assessment Total Assessment is a certain percentage of the fair market value that is determined by local assessors to be the total taxable value of land and additions on the property. | Land | Improvement |
|---|---|---|---|---|
| 2025 | $4,945 | $209,093 | $51,624 | $157,469 |
| 2023 | $4,945 | $200,975 | $49,620 | $151,355 |
| 2022 | $4,873 | $197,036 | $48,648 | $148,388 |
| 2021 | $4,833 | $193,174 | $47,695 | $145,479 |
| 2020 | $4,799 | $191,194 | $47,206 | $143,988 |
| 2019 | $4,752 | $187,446 | $46,281 | $141,165 |
| 2018 | $4,696 | $183,772 | $45,374 | $138,398 |
| 2017 | $4,668 | $180,170 | $44,485 | $135,685 |
| 2016 | $6,251 | $176,638 | $43,613 | $133,025 |
| 2015 | $6,252 | $173,987 | $42,959 | $131,028 |
| 2014 | $6,192 | $170,580 | $42,118 | $128,462 |
Source: Public Records
Map
Nearby Homes
- 1874 Balsawood Dr
- 1886 Tamarack Ln
- 3061 Thyme Way
- 3032 Thyme Way
- 3147 Red Cedar Trail
- 1725 Gazebo Ln
- 3035 Cat Tail Ct
- 2830 Banyan Tree Ln
- 3215 Tumbleweed Rd
- 3051 Mill Ridge Dr
- 2635 Beech Tree St
- 1408 Brentwood Way
- 2534 Beech Tree St
- 3733 Cougar Canyon Rd
- 2918 Dogwood Way
- 1457 Angelus Hill Rd
- 1354 Jasmine Way
- 2157 Pecan Tree St
- 1339 Basswood Way
- 1458 Fallbrook Ave
- 1751 Cross Gateway St
- 1767 Cross Gateway St
- 3045 Caper Bush Ct
- 1743 Cross Gateway St
- 1777 Cross Gateway St
- 1849 Balsawood Dr
- 1735 Cross Gateway St
- 1837 Balsawood Dr
- 1783 Cross Gateway St
- 3065 Caper Bush Ct
- 1861 Balsawood Dr
- 3046 Caper Bush Ct
- 3086 Hibiscus Pointe
- 3076 Hibiscus Point
- 1825 Balsawood Dr
- 1873 Balsawood Dr
- 3086 Hibiscus Point
- 1727 Cross Gateway St
- 1793 Cross Gateway St
- 1813 Balsawood Dr