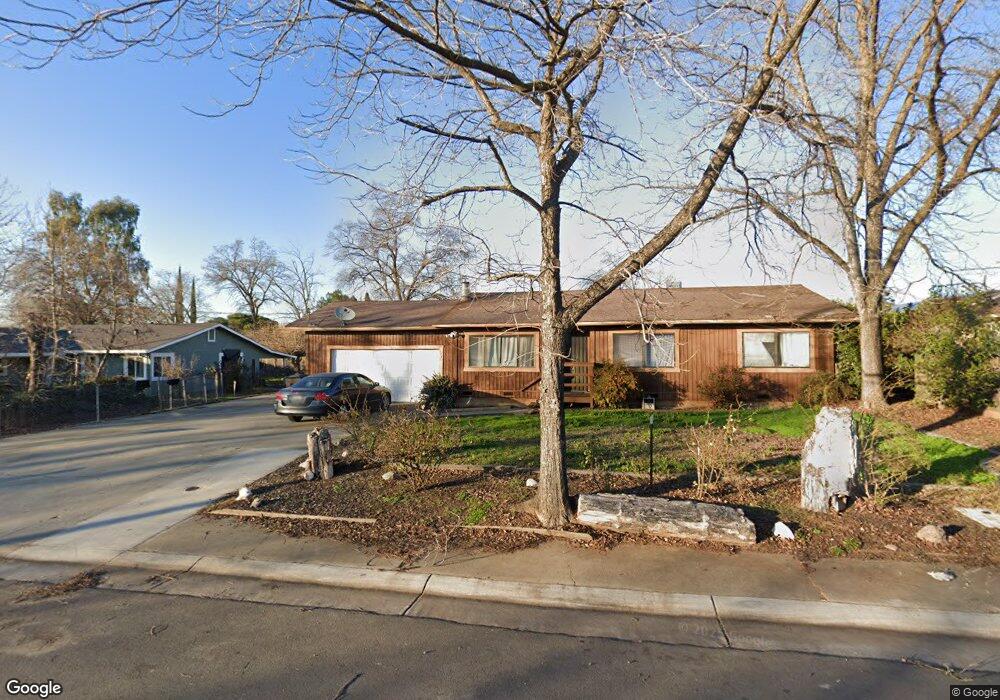
176 E 7th St Lincoln, CA 95648
Estimated Value: $355,000 - $455,337
3
Beds
2
Baths
1,066
Sq Ft
$396/Sq Ft
Est. Value
About This Home
This home is located at 176 E 7th St, Lincoln, CA 95648 and is currently estimated at $422,334, approximately $396 per square foot. 176 E 7th St is a home located in Placer County with nearby schools including Carlin C. Coppin Elementary, Glen Edwards Middle, and Lincoln High.
Ownership History
Date
Name
Owned For
Owner Type
Purchase Details
Closed on
Aug 14, 2019
Sold by
Dobbs Billy Wade
Bought by
Dobbs Billy Wade
Current Estimated Value
Home Financials for this Owner
Home Financials are based on the most recent Mortgage that was taken out on this home.
Original Mortgage
$243,500
Outstanding Balance
$213,261
Interest Rate
3.7%
Mortgage Type
New Conventional
Estimated Equity
$209,073
Purchase Details
Closed on
Aug 22, 2016
Sold by
Ilharramendy Gary
Bought by
Dobbs Billy Wade
Home Financials for this Owner
Home Financials are based on the most recent Mortgage that was taken out on this home.
Original Mortgage
$250,381
Interest Rate
3.5%
Mortgage Type
FHA
Purchase Details
Closed on
Jun 3, 2013
Sold by
Ilharramendy Gary
Bought by
Ilharramendy Gary
Purchase Details
Closed on
Feb 12, 1998
Sold by
Ilharrmendy Julian W
Bought by
Ilharramendy Julian W
Purchase Details
Closed on
Nov 18, 1993
Sold by
Geiser Iris L
Bought by
Ilharramendy Julian W
Create a Home Valuation Report for This Property
The Home Valuation Report is an in-depth analysis detailing your home's value as well as a comparison with similar homes in the area
Home Values in the Area
Average Home Value in this Area
Purchase History
| Date | Buyer | Sale Price | Title Company |
|---|---|---|---|
| Dobbs Billy Wade | -- | Old Republic Title Company | |
| Dobbs Billy Wade | $255,000 | North American Title Co Inc | |
| Ilharramendy Gary | -- | None Available | |
| Ilharramendy Julian W | -- | -- | |
| Ilharramendy Julian W | -- | North American Title Co |
Source: Public Records
Mortgage History
| Date | Status | Borrower | Loan Amount |
|---|---|---|---|
| Open | Dobbs Billy Wade | $243,500 | |
| Closed | Dobbs Billy Wade | $250,381 |
Source: Public Records
Tax History
| Year | Tax Paid | Tax Assessment Tax Assessment Total Assessment is a certain percentage of the fair market value that is determined by local assessors to be the total taxable value of land and additions on the property. | Land | Improvement |
|---|---|---|---|---|
| 2025 | $3,083 | $295,943 | $87,041 | $208,902 |
| 2023 | $3,083 | $284,453 | $83,662 | $200,791 |
| 2022 | $2,997 | $278,876 | $82,022 | $196,854 |
| 2021 | $2,939 | $273,409 | $80,414 | $192,995 |
| 2020 | $2,923 | $270,607 | $79,590 | $191,017 |
| 2019 | $2,847 | $265,302 | $78,030 | $187,272 |
| 2018 | $2,777 | $260,100 | $76,500 | $183,600 |
| 2017 | $2,688 | $255,000 | $75,000 | $180,000 |
| 2016 | $670 | $61,872 | $7,869 | $54,003 |
| 2015 | $583 | $60,943 | $7,751 | $53,192 |
| 2014 | $567 | $59,751 | $7,600 | $52,151 |
Source: Public Records
Map
Nearby Homes
- 149 E 5th St
- 654 B St
- 1025 Wilson Ave
- 849 Hadley Dr
- 823 Riley Way
- 1551 Cascade Way
- 859 Riley Way
- 530 5th St
- 5605 McCourtney Rd
- 1003 Carson River Dr
- 312 D St
- 1697 Donner Ln
- 512 Spruce Ct
- 1886 Spooner Lake Loop
- 394 Lincoln Blvd
- 2091 Marlette Way
- 2086 Marlette Way
- 2079 Marlette Way
- 2019 Marlette Way
- 388 Ashwood Way
Your Personal Tour Guide
Ask me questions while you tour the home.