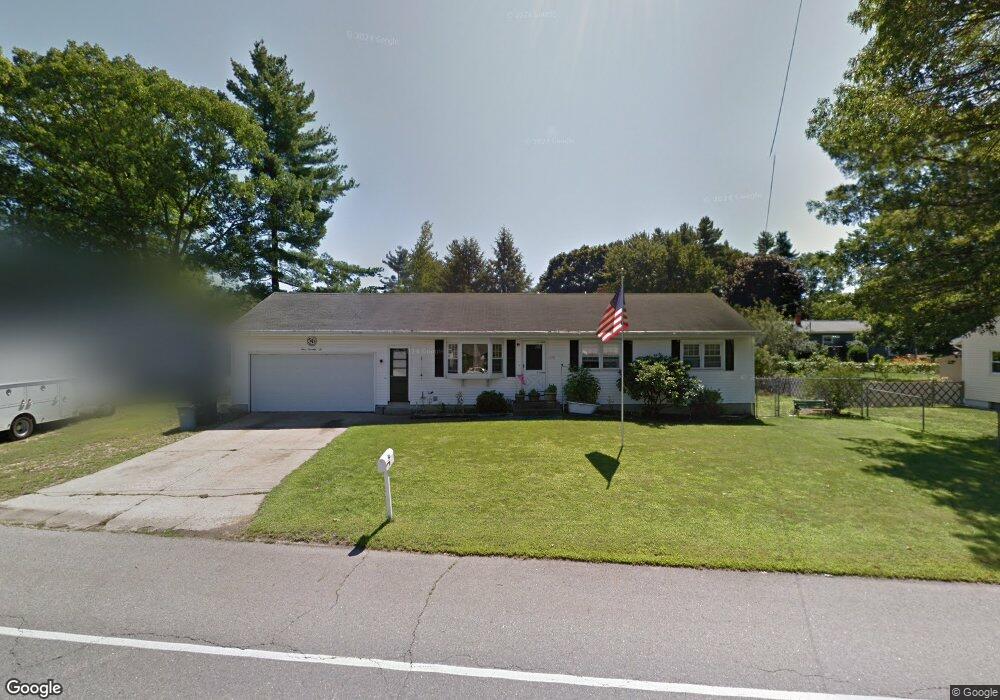
176 E Dunstable Rd Nashua, NH 03062
Southwest Nashua NeighborhoodEstimated Value: $467,046 - $511,000
3
Beds
1
Bath
1,008
Sq Ft
$490/Sq Ft
Est. Value
About This Home
This home is located at 176 E Dunstable Rd, Nashua, NH 03062 and is currently estimated at $494,012, approximately $490 per square foot. 176 E Dunstable Rd is a home located in Hillsborough County with nearby schools including Bicentennial Elementary School, Fairgrounds Middle School, and Nashua High School South.
Ownership History
Date
Name
Owned For
Owner Type
Purchase Details
Closed on
Feb 22, 2018
Sold by
Higson Michael W
Bought by
Higson 2018 T and Higson H
Current Estimated Value
Purchase Details
Closed on
Jul 28, 2000
Sold by
Mcnally Edward H and Mcnally Lorraine J
Bought by
Higson Michael W
Home Financials for this Owner
Home Financials are based on the most recent Mortgage that was taken out on this home.
Original Mortgage
$154,200
Interest Rate
8.18%
Mortgage Type
Purchase Money Mortgage
Create a Home Valuation Report for This Property
The Home Valuation Report is an in-depth analysis detailing your home's value as well as a comparison with similar homes in the area
Home Values in the Area
Average Home Value in this Area
Purchase History
| Date | Buyer | Sale Price | Title Company |
|---|---|---|---|
| Higson 2018 T | -- | -- | |
| Higson Michael W | $159,000 | -- |
Source: Public Records
Mortgage History
| Date | Status | Borrower | Loan Amount |
|---|---|---|---|
| Previous Owner | Higson Michael W | $179,894 | |
| Previous Owner | Higson Michael W | $174,000 | |
| Previous Owner | Higson Michael W | $154,200 |
Source: Public Records
Tax History
| Year | Tax Paid | Tax Assessment Tax Assessment Total Assessment is a certain percentage of the fair market value that is determined by local assessors to be the total taxable value of land and additions on the property. | Land | Improvement |
|---|---|---|---|---|
| 2025 | $7,935 | $471,500 | $151,300 | $320,200 |
| 2024 | $7,497 | $471,500 | $151,300 | $320,200 |
| 2023 | $7,221 | $396,100 | $121,000 | $275,100 |
| 2022 | $7,158 | $396,100 | $121,000 | $275,100 |
| 2021 | $6,590 | $283,800 | $80,700 | $203,100 |
| 2020 | $6,381 | $282,200 | $80,700 | $201,500 |
| 2019 | $6,141 | $282,200 | $80,700 | $201,500 |
| 2018 | $5,985 | $282,200 | $80,700 | $201,500 |
| 2017 | $5,065 | $196,400 | $76,900 | $119,500 |
| 2016 | $4,924 | $196,400 | $76,900 | $119,500 |
| 2015 | $4,536 | $184,900 | $76,900 | $108,000 |
| 2014 | $4,447 | $184,900 | $76,900 | $108,000 |
Source: Public Records
Map
Nearby Homes
- 8 Meadowbrook Dr
- 2 Doncaster Dr
- 16 Emerson Rd
- 20 Nightingale Rd
- 12 Oakdale Ave
- 154 Westwood Dr
- 70 Tenby Dr
- 20 Salmon Brook Dr
- 29 Nottingham Dr
- 5 Wilderness Dr
- 4 Lisa Dr
- 244 Harris Rd
- 25 E Dunstable Rd
- 1 Thompson Rd Unit 109
- 4 Henry David Dr Unit 103
- 4 Henry David Dr Unit 203
- 5 Ronnie Dr
- 16 Champagne Dr Unit U31
- 6 Hayden St
- 397 S Main St
Your Personal Tour Guide
Ask me questions while you tour the home.