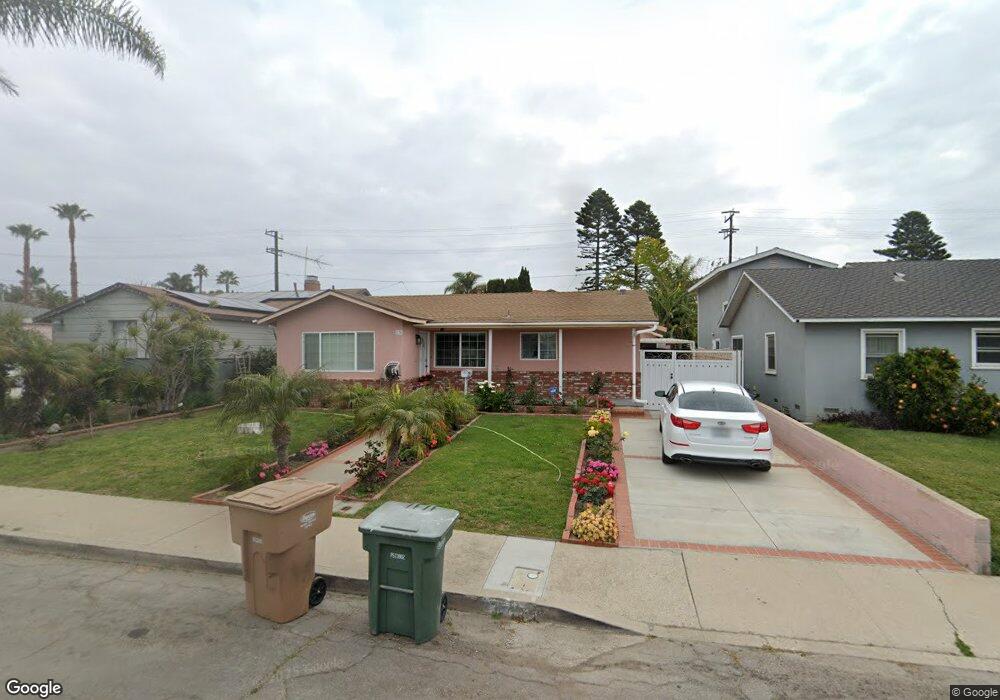
176 Lang St Ventura, CA 93003
Midtown NeighborhoodEstimated Value: $817,043 - $1,027,000
2
Beds
1
Bath
1,156
Sq Ft
$790/Sq Ft
Est. Value
About This Home
This home is located at 176 Lang St, Ventura, CA 93003 and is currently estimated at $913,761, approximately $790 per square foot. 176 Lang St is a home located in Ventura County with nearby schools including Loma Vista Elementary School, Cabrillo Middle School, and Ventura High School.
Ownership History
Date
Name
Owned For
Owner Type
Purchase Details
Closed on
Jan 28, 1999
Sold by
Glasspoole Karon J
Bought by
Sandoval Felipe and Sandoval Rebeca
Current Estimated Value
Home Financials for this Owner
Home Financials are based on the most recent Mortgage that was taken out on this home.
Original Mortgage
$151,920
Outstanding Balance
$35,835
Interest Rate
6.7%
Estimated Equity
$877,926
Purchase Details
Closed on
Apr 6, 1994
Sold by
Glasspoole Sherman J
Bought by
Glasspoole Sherman J and Glasspoole Bret L
Home Financials for this Owner
Home Financials are based on the most recent Mortgage that was taken out on this home.
Original Mortgage
$130,000
Interest Rate
7.59%
Create a Home Valuation Report for This Property
The Home Valuation Report is an in-depth analysis detailing your home's value as well as a comparison with similar homes in the area
Home Values in the Area
Average Home Value in this Area
Purchase History
| Date | Buyer | Sale Price | Title Company |
|---|---|---|---|
| Sandoval Felipe | $190,000 | Fidelity National Title | |
| Glasspoole Sherman J | -- | Fidelity National Title |
Source: Public Records
Mortgage History
| Date | Status | Borrower | Loan Amount |
|---|---|---|---|
| Open | Sandoval Felipe | $151,920 | |
| Previous Owner | Glasspoole Sherman J | $130,000 |
Source: Public Records
Tax History Compared to Growth
Tax History
| Year | Tax Paid | Tax Assessment Tax Assessment Total Assessment is a certain percentage of the fair market value that is determined by local assessors to be the total taxable value of land and additions on the property. | Land | Improvement |
|---|---|---|---|---|
| 2025 | $3,219 | $297,677 | $235,146 | $62,531 |
| 2024 | $3,219 | $291,841 | $230,536 | $61,305 |
| 2023 | $3,180 | $286,119 | $226,016 | $60,103 |
| 2022 | $2,964 | $280,509 | $221,584 | $58,925 |
| 2021 | $2,907 | $275,009 | $217,239 | $57,770 |
| 2020 | $2,879 | $272,191 | $215,012 | $57,179 |
| 2019 | $2,826 | $266,855 | $210,797 | $56,058 |
| 2018 | $2,778 | $261,623 | $206,664 | $54,959 |
| 2017 | $2,720 | $256,494 | $202,612 | $53,882 |
| 2016 | $2,667 | $251,466 | $198,640 | $52,826 |
| 2015 | $2,638 | $247,691 | $195,657 | $52,034 |
| 2014 | $2,594 | $242,841 | $191,825 | $51,016 |
Source: Public Records
Map
Nearby Homes
- 3179 Porter Ln
- 3302 San Luis St
- 220 Frances St
- 401 S Brent St
- 3345 Porter Ln
- 664 Lemon Grove Ave
- 3353 Porter Ln
- 431 Eva St
- 114 San Marino Ave
- 297 Rancho Dr
- 561 S Brent St
- 3750 Mound Ave
- 3700 Dean Dr Unit 1101
- 3700 Dean Dr Unit 2106
- 3700 Dean Dr Unit 302
- 3700 Dean Dr Unit 1207
- 476 Howard St
- 501 Redwood Ave
- 344 S Evergreen Dr
- 251 Palomares Ave