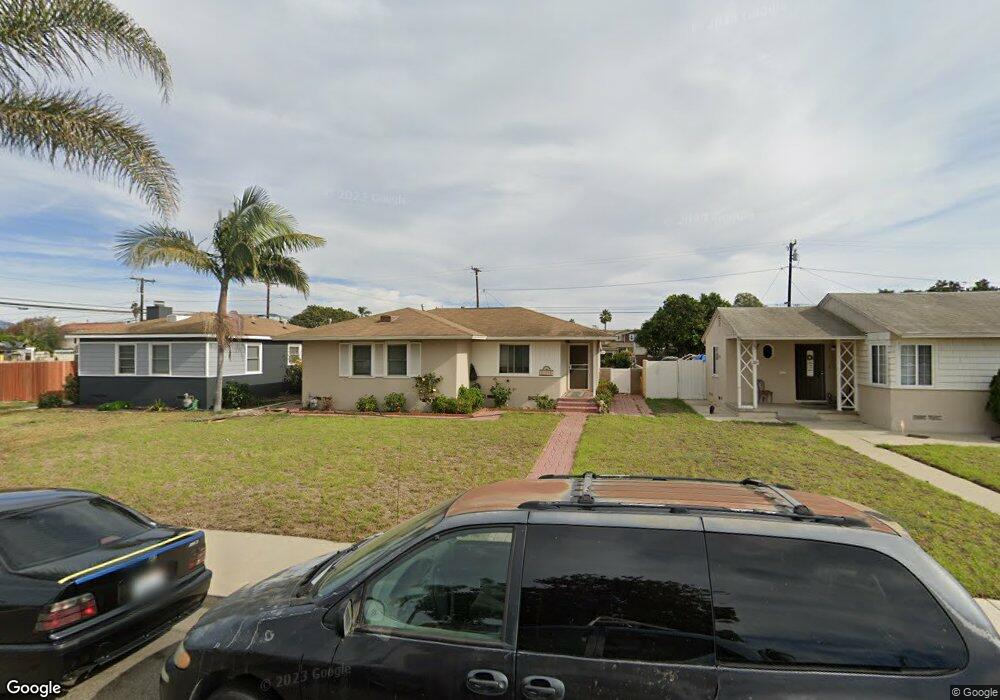
176 N I St Oxnard, CA 93030
Fremont South NeighborhoodEstimated Value: $650,000 - $706,000
3
Beds
1
Bath
1,400
Sq Ft
$486/Sq Ft
Est. Value
About This Home
This home is located at 176 N I St, Oxnard, CA 93030 and is currently estimated at $679,972, approximately $485 per square foot. 176 N I St is a home located in Ventura County with nearby schools including Emilie Ritchen Elementary School, Pacifica High School, and Vista Real Charter High School.
Ownership History
Date
Name
Owned For
Owner Type
Purchase Details
Closed on
May 15, 2003
Sold by
Rojo Sophie G and The Sophie G Rojo 1988 Trust
Bought by
Marquez Rosanna
Current Estimated Value
Purchase Details
Closed on
Apr 20, 1995
Sold by
Colen Harold E
Bought by
Rojo Sophie G
Home Financials for this Owner
Home Financials are based on the most recent Mortgage that was taken out on this home.
Original Mortgage
$89,600
Interest Rate
8.43%
Create a Home Valuation Report for This Property
The Home Valuation Report is an in-depth analysis detailing your home's value as well as a comparison with similar homes in the area
Home Values in the Area
Average Home Value in this Area
Purchase History
| Date | Buyer | Sale Price | Title Company |
|---|---|---|---|
| Marquez Rosanna | -- | Title Court | |
| Rojo Sophie G | $128,000 | Commonwealth Land Title Co |
Source: Public Records
Mortgage History
| Date | Status | Borrower | Loan Amount |
|---|---|---|---|
| Closed | Rojo Sophie G | $89,600 |
Source: Public Records
Tax History
| Year | Tax Paid | Tax Assessment Tax Assessment Total Assessment is a certain percentage of the fair market value that is determined by local assessors to be the total taxable value of land and additions on the property. | Land | Improvement |
|---|---|---|---|---|
| 2025 | $2,643 | $214,965 | $134,358 | $80,607 |
| 2024 | $2,643 | $210,750 | $131,723 | $79,027 |
| 2023 | $2,548 | $206,618 | $129,140 | $77,478 |
| 2022 | $2,472 | $202,567 | $126,608 | $75,959 |
| 2021 | $2,452 | $198,596 | $124,126 | $74,470 |
| 2020 | $2,497 | $196,561 | $122,854 | $73,707 |
| 2019 | $2,428 | $192,708 | $120,446 | $72,262 |
| 2018 | $2,394 | $188,931 | $118,085 | $70,846 |
| 2017 | $2,274 | $185,227 | $115,770 | $69,457 |
| 2016 | $2,195 | $181,596 | $113,500 | $68,096 |
| 2015 | $2,218 | $178,871 | $111,797 | $67,074 |
| 2014 | $2,194 | $175,369 | $109,608 | $65,761 |
Source: Public Records
Map
Nearby Homes
- 1150 W 1st St
- 1131 W 2nd St
- 307 N F St Unit 102
- 151 S F St
- 462 N M St
- 201 203 S E St
- 1127 Douglas Ave
- 425 W 1st St
- 800 S A St
- 722 W Robert Ave
- 715 W Robert Ave
- 550 S G St
- 246 Doris Ave
- 603 S G St
- 255 Douglas Ave
- 1341 Edgewood Way Unit 23
- 411 Eastwood Dr
- 807 Kingfisher Way
- 400 N Hayes Ave
- 1309 Nautical Way
Your Personal Tour Guide
Ask me questions while you tour the home.