Estimated Value: $179,140 - $234,000
--
Bed
--
Bath
1,826
Sq Ft
$114/Sq Ft
Est. Value
About This Home
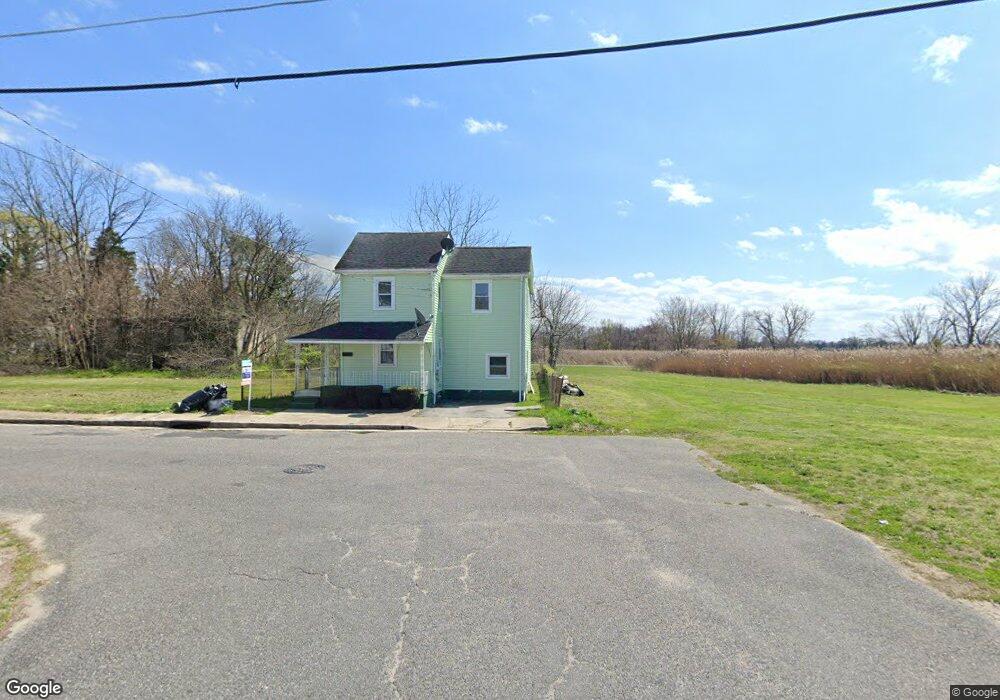
This home is located at 176 N Union St, Salem, NJ 08079 and is currently estimated at $208,285, approximately $114 per square foot. 176 N Union St is a home located in Salem County with nearby schools including John Fenwick Elementary School, Salem Middle School, and Salem High School.
Ownership History
Date
Name
Owned For
Owner Type
Purchase Details
Closed on
Dec 22, 2004
Sold by
Callahan Christopher G
Bought by
Callahan Christopher G and Callahan Dominique M
Current Estimated Value
Home Financials for this Owner
Home Financials are based on the most recent Mortgage that was taken out on this home.
Original Mortgage
$4,762
Interest Rate
5.74%
Mortgage Type
Stand Alone Second
Create a Home Valuation Report for This Property
The Home Valuation Report is an in-depth analysis detailing your home's value as well as a comparison with similar homes in the area
Home Values in the Area
Average Home Value in this Area
Purchase History
| Date | Buyer | Sale Price | Title Company |
|---|---|---|---|
| Callahan Christopher G | -- | Salem Oak Title Agency Inc | |
| Callahan Christopher G | $120,000 | Salem Oak Title Agency Inc |
Source: Public Records
Mortgage History
| Date | Status | Borrower | Loan Amount |
|---|---|---|---|
| Closed | Callahan Christopher G | $4,762 | |
| Open | Callahan Christopher G | $119,059 |
Source: Public Records
Tax History Compared to Growth
Tax History
| Year | Tax Paid | Tax Assessment Tax Assessment Total Assessment is a certain percentage of the fair market value that is determined by local assessors to be the total taxable value of land and additions on the property. | Land | Improvement |
|---|---|---|---|---|
| 2025 | $5,616 | $68,300 | $18,400 | $49,900 |
| 2024 | $5,369 | $68,300 | $18,400 | $49,900 |
| 2023 | $5,369 | $68,300 | $18,400 | $49,900 |
| 2022 | $5,134 | $68,300 | $18,400 | $49,900 |
| 2021 | $4,957 | $68,300 | $18,400 | $49,900 |
| 2020 | $4,858 | $68,300 | $18,400 | $49,900 |
| 2019 | $4,828 | $68,300 | $18,400 | $49,900 |
| 2018 | $4,722 | $68,300 | $18,400 | $49,900 |
| 2017 | $4,665 | $68,300 | $18,400 | $49,900 |
| 2016 | $5,580 | $142,500 | $17,200 | $125,300 |
| 2015 | $5,509 | $142,500 | $17,200 | $125,300 |
| 2014 | $5,481 | $142,500 | $17,200 | $125,300 |
Source: Public Records
Map
Nearby Homes
- 174 N Union St
- 180 N Union St
- 174 New Union St
- 177 N Union St
- 327 Fenwick Ave
- 350 Morrison Ave
- 336 Morrison Ave
- 322 Fenwick Ave
- Union St
- 325 Fenwick Ave
- 330 Morrison Ave
- 352 Morrison Ave
- 323 Fenwick Ave
- 326 Morrison Ave
- 4 N Union St
- 354 Morrison Ave
- 322 Morrison Ave
- 155 N Union St
- 355 Morrison Ave
- 318 Fenwick Ave