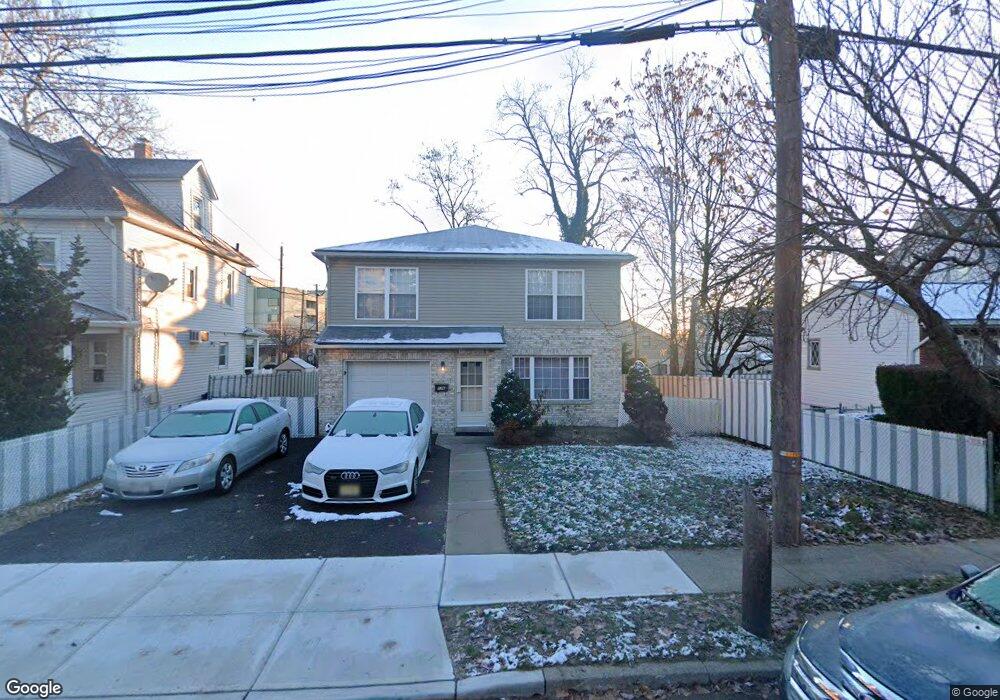
176 Pine St Hackensack, NJ 07601
Estimated Value: $721,665 - $853,000
Studio
--
Bath
1,972
Sq Ft
$394/Sq Ft
Est. Value
About This Home
This home is located at 176 Pine St, Hackensack, NJ 07601 and is currently estimated at $776,916, approximately $393 per square foot. 176 Pine St is a home located in Bergen County with nearby schools including Hackensack High School, Bergen County Christian Academy, and Ben Porat Yosef.
Ownership History
Date
Name
Owned For
Owner Type
Purchase Details
Closed on
Mar 29, 2000
Sold by
Romas Holding Co Inc
Bought by
Nowroozi Matt and Nowroozi Tom
Current Estimated Value
Home Financials for this Owner
Home Financials are based on the most recent Mortgage that was taken out on this home.
Original Mortgage
$224,910
Outstanding Balance
$77,995
Interest Rate
8.4%
Estimated Equity
$698,921
Purchase Details
Closed on
Jan 20, 2000
Sold by
Pargagon Construction Inc
Bought by
Romas Holding Co Inc and Paragon Construction Inc
Home Financials for this Owner
Home Financials are based on the most recent Mortgage that was taken out on this home.
Original Mortgage
$100,000
Interest Rate
7.91%
Purchase Details
Closed on
Apr 14, 1999
Sold by
Sugalski Jeffrey W and Sugalski Linda A
Bought by
Paragon Construction Inc
Purchase Details
Closed on
Jan 12, 1999
Sold by
Sugalski Jeffrey W and Sugalski Linda A
Bought by
Sugalski Jeffrey W and Sugalski Linda W
Create a Home Valuation Report for This Property
The Home Valuation Report is an in-depth analysis detailing your home's value as well as a comparison with similar homes in the area
Home Values in the Area
Average Home Value in this Area
Purchase History
| Date | Buyer | Sale Price | Title Company |
|---|---|---|---|
| Nowroozi Matt | $249,900 | -- | |
| Romas Holding Co Inc | -- | -- | |
| Paragon Construction Inc | $60,000 | -- | |
| Sugalski Jeffrey W | -- | -- |
Source: Public Records
Mortgage History
| Date | Status | Borrower | Loan Amount |
|---|---|---|---|
| Open | Nowroozi Matt | $224,910 | |
| Previous Owner | Romas Holding Co Inc | $100,000 |
Source: Public Records
Tax History
| Year | Tax Paid | Tax Assessment Tax Assessment Total Assessment is a certain percentage of the fair market value that is determined by local assessors to be the total taxable value of land and additions on the property. | Land | Improvement |
|---|---|---|---|---|
| 2025 | $14,984 | $490,300 | $192,400 | $297,900 |
| 2024 | $14,116 | $490,300 | $192,400 | $297,900 |
| 2023 | $13,534 | $490,300 | $192,400 | $297,900 |
| 2022 | $13,534 | $483,000 | $185,300 | $297,700 |
| 2021 | $13,237 | $394,200 | $155,300 | $238,900 |
| 2020 | $13,044 | $394,200 | $155,300 | $238,900 |
| 2019 | $13,076 | $389,500 | $153,000 | $236,500 |
| 2018 | $13,157 | $385,500 | $149,600 | $235,900 |
| 2017 | $12,997 | $380,600 | $147,300 | $233,300 |
| 2016 | $12,286 | $363,700 | $133,000 | $230,700 |
| 2015 | $12,611 | $360,300 | $150,000 | $210,300 |
| 2014 | $11,969 | $360,300 | $150,000 | $210,300 |
Source: Public Records
Map
Nearby Homes
- 32 Martin Terrace
- 29 Martin Terrace
- 67 Spring Valley Ave
- 95 Cedar Ave
- 30 Willow Ave
- 15 Zabriskie St Unit 1505
- 120 Louis St
- 75 Pine St
- 25 Jefferson St Unit 3D
- 16 Jefferson St
- 150 Grand Ave Unit 1A
- 20 Jefferson St Unit B10
- 81 Fairmount Ave
- 207 Elm Ave
- 241 Johnson Ave Unit N2
- 245 Johnson Ave Unit K1
- 31 Fairmount Ave Unit 16A
- 31 Fairmount Ave
- 258 Ross Ave
- 149 Allen St
Your Personal Tour Guide
Ask me questions while you tour the home.