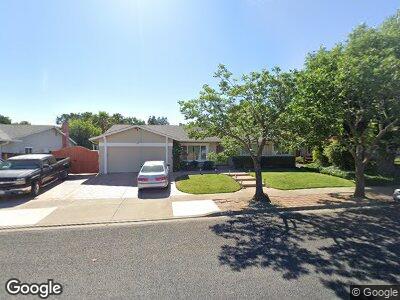
1760 Claycord Ave Concord, CA 94521
Heather Glen NeighborhoodEstimated Value: $879,000 - $964,000
3
Beds
2
Baths
1,737
Sq Ft
$531/Sq Ft
Est. Value
About This Home
This home is located at 1760 Claycord Ave, Concord, CA 94521 and is currently estimated at $922,045, approximately $530 per square foot. 1760 Claycord Ave is a home located in Contra Costa County with nearby schools including Silverwood Elementary School, Pine Hollow Middle School, and College Park High School.
Ownership History
Date
Name
Owned For
Owner Type
Purchase Details
Closed on
May 17, 2006
Sold by
Raulston Ronald L and Rucker Raulston Cynthia K
Bought by
Raulston Ronald L and Rucker Raulston Cynthia K
Current Estimated Value
Home Financials for this Owner
Home Financials are based on the most recent Mortgage that was taken out on this home.
Original Mortgage
$400,000
Interest Rate
6.46%
Mortgage Type
Fannie Mae Freddie Mac
Purchase Details
Closed on
Sep 13, 2005
Sold by
Peterson Michael W and Peterson Sandra K
Bought by
Raulston Ronald L and Raulston Cynthia K
Home Financials for this Owner
Home Financials are based on the most recent Mortgage that was taken out on this home.
Original Mortgage
$445,000
Interest Rate
5.37%
Mortgage Type
Fannie Mae Freddie Mac
Create a Home Valuation Report for This Property
The Home Valuation Report is an in-depth analysis detailing your home's value as well as a comparison with similar homes in the area
Home Values in the Area
Average Home Value in this Area
Purchase History
| Date | Buyer | Sale Price | Title Company |
|---|---|---|---|
| Raulston Ronald L | -- | Chicago Title Co | |
| Raulston Ronald L | $655,000 | Chicago Title |
Source: Public Records
Mortgage History
| Date | Status | Borrower | Loan Amount |
|---|---|---|---|
| Open | Raulston Ronald L | $316,600 | |
| Closed | Raulston Ronald L | $390,936 | |
| Closed | Raulston Ronald L | $404,500 | |
| Closed | Raulston Ronald L | $401,700 | |
| Closed | Raulston Ronald L | $400,000 | |
| Closed | Raulston Ronald L | $445,000 | |
| Previous Owner | Peterson Michael W | $145,000 | |
| Previous Owner | Peterson Michael W | $142,000 |
Source: Public Records
Tax History Compared to Growth
Tax History
| Year | Tax Paid | Tax Assessment Tax Assessment Total Assessment is a certain percentage of the fair market value that is determined by local assessors to be the total taxable value of land and additions on the property. | Land | Improvement |
|---|---|---|---|---|
| 2024 | $10,357 | $877,547 | $543,813 | $333,734 |
| 2023 | $10,357 | $860,341 | $533,150 | $327,191 |
| 2022 | $10,231 | $843,473 | $522,697 | $320,776 |
| 2021 | $8,794 | $720,000 | $446,000 | $274,000 |
| 2019 | $8,339 | $673,000 | $417,055 | $255,945 |
| 2018 | $7,454 | $608,500 | $377,085 | $231,415 |
| 2017 | $6,860 | $565,000 | $350,128 | $214,872 |
| 2016 | $6,521 | $540,000 | $334,636 | $205,364 |
| 2015 | $5,509 | $447,500 | $277,314 | $170,186 |
| 2014 | $5,092 | $410,500 | $254,385 | $156,115 |
Source: Public Records
Map
Nearby Homes
- 1715 Berrywood Dr
- 1818 Wildbrook Ct Unit C
- 1728 Netto Ct
- 1840 Earl Ln
- 1808 Roberts Ct
- 4554 Concord Blvd
- 1689 Joelle Dr
- 4823 Beckham Ct
- 1557 Wales Ct
- 4889 Cherokee Dr
- 4701 Myrtle Dr
- 1533 Parkwood Place
- 5111 Paul Scarlet Dr
- 1525 Ayers Rd
- 4888 Clayton Rd Unit 44
- 4888 Clayton Rd Unit 41
- 1524 Matheson Rd Unit 8
- 1524 Matheson Rd Unit 14
- 1544 Bailey Rd Unit 30
- 1544 Bailey Rd Unit 33
- 1760 Claycord Ave
- 1766 Claycord Ave
- 1750 Claycord Ave
- 1761 Claycord Ave
- 1740 Claycord Ave
- 1770 Claycord Ave
- 1745 Claycord Ave
- 1767 Claycord Ave
- 1730 Claycord Ave
- 1739 Claycord Ave
- 1771 Claycord Ave
- 4787 Mintwood Dr
- 1778 Claycord Ave
- 1779 Trailcreek Ct
- 1773 Trailcreek Ct
- 4788 Mintwood Dr
- 1785 Trailcreek Ct
- 1731 Claycord Ave
- 1770 Trailcreek Ct
- 1720 Claycord Ave