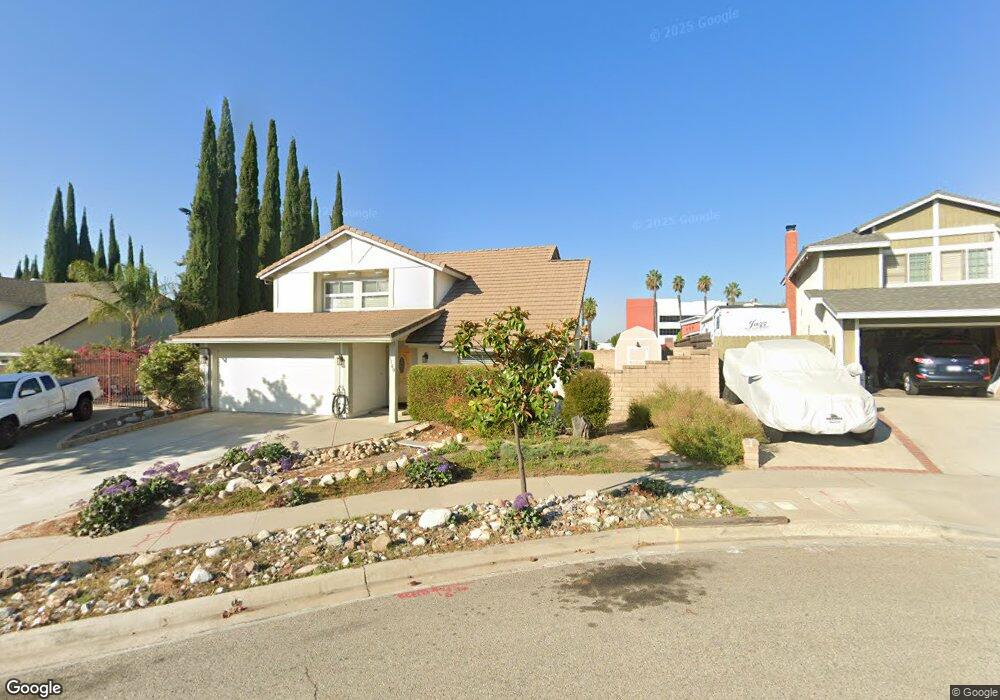
1760 Morley St Simi Valley, CA 93065
Central Simi Valley NeighborhoodEstimated Value: $842,000 - $1,040,000
About This Home
This home is located at 1760 Morley St, Simi Valley, CA 93065 and is currently estimated at $911,060, approximately $472 per square foot. 1760 Morley St is a home located in Ventura County with nearby schools including Berylwood Elementary School, Hillside Middle School, and Royal High School.
Ownership History
We collect this data history from publicly available records. To have your information removed, we recommend requesting removal directly through your county’s website.
Purchase Details
Purchase Details
Home Financials for this Owner
Home Financials are based on the most recent Mortgage that was taken out on this home.Home Values in the Area
Average Home Value in this Area
Purchase History
We collect this data history from publicly available records. To have your information removed, we recommend requesting removal directly through your county’s website.
| Date | Buyer | Sale Price | Title Company |
|---|---|---|---|
| -- | None Listed On Document | ||
| -- | North American Title | ||
| -- | North American Title |
Mortgage History
We collect this data history from publicly available records. To have your information removed, we recommend requesting removal directly through your county’s website.
| Date | Status | Borrower | Loan Amount |
|---|---|---|---|
| Previous Owner | $190,000 |
Tax History
We collect this data history from publicly available records. To have your information removed, we recommend requesting removal directly through your county’s website.
| Year | Tax Paid | Tax Assessment Tax Assessment Total Assessment is a certain percentage of the fair market value that is determined by local assessors to be the total taxable value of land and additions on the property. | Land | Improvement |
|---|---|---|---|---|
| 2025 | $4,122 | $296,655 | $103,124 | $193,531 |
| 2024 | $4,074 | $290,839 | $101,102 | $189,737 |
| 2023 | $3,838 | $285,137 | $99,120 | $186,017 |
| 2022 | $3,804 | $279,547 | $97,177 | $182,370 |
| 2021 | $3,760 | $274,066 | $95,271 | $178,795 |
| 2020 | $3,674 | $271,257 | $94,295 | $176,962 |
| 2019 | $3,512 | $265,940 | $92,447 | $173,493 |
| 2018 | $3,471 | $260,727 | $90,635 | $170,092 |
| 2017 | $3,389 | $255,615 | $88,858 | $166,757 |
| 2016 | $3,240 | $250,604 | $87,116 | $163,488 |
| 2015 | $3,166 | $246,841 | $85,808 | $161,033 |
| 2014 | $3,113 | $242,008 | $84,128 | $157,880 |
Map
- 2031 Morning Glory St
- 1908 Morley St
- 1904 Heywood St Unit L
- 1932 Heywood St Unit B
- 1868 Cloud Ct
- 2053 Malcolm St
- 1755 Heywood St Unit 106
- 1755 Heywood St Unit 201
- 1755 Heywood St Unit 203
- 1740 Patricia Ave
- 2235 Burnside St
- 1692 Alviso St
- 1690 Heywood St Unit C
- 1720 Anderson St
- 1536 Earl Ave
- 2311 Marvel Ave
- 1608 Alviso St
- 2371 Larch St
- 2148 Elmdale Ave
- 2357 Lawnview Ct
- 1786 Morley St
- 1738 Morley St
- 1816 Morley St
- 1712 Morley St
- 1966 Morning Glory St
- 1761 Morley St
- 1713 Morley St
- 1824 Morley St
- 1739 Morley St
- 1978 Morning Glory St
- 2005 Denny St
- 1830 Morley St
- 1990 Morning Glory St
- 2017 Denny St
- 2003 Morning Glory St
- 2011 Morning Glory St
- 2004 Morning Glory St
- 1838 Morley St
- 2029 Denny St
- 2017 Morning Glory St
Ask me questions while you tour the home.