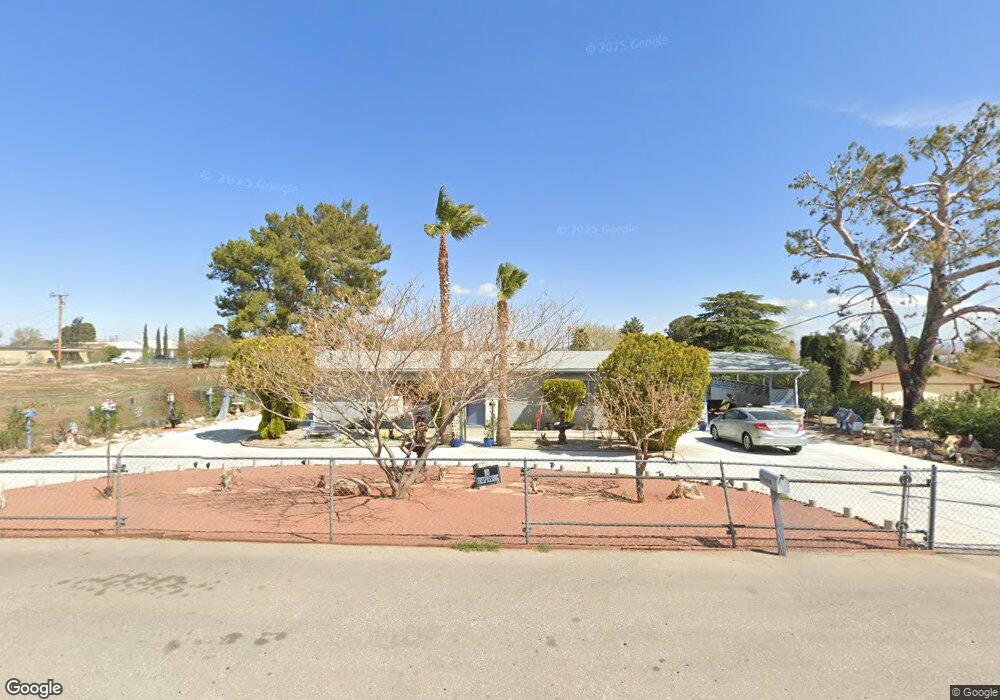
17604 Yucca St Hesperia, CA 92345
Estimated Value: $306,495 - $393,000
2
Beds
2
Baths
960
Sq Ft
$372/Sq Ft
Est. Value
About This Home
This home is located at 17604 Yucca St, Hesperia, CA 92345 and is currently estimated at $356,874, approximately $371 per square foot. 17604 Yucca St is a home located in San Bernardino County with nearby schools including Juniper Elementary School, Ranchero Middle School, and Sultana High School.
Ownership History
Date
Name
Owned For
Owner Type
Purchase Details
Closed on
Sep 22, 2022
Sold by
Thompson Eva
Bought by
Ryan Gabriella
Current Estimated Value
Home Financials for this Owner
Home Financials are based on the most recent Mortgage that was taken out on this home.
Original Mortgage
$120,000
Outstanding Balance
$115,012
Interest Rate
5.66%
Mortgage Type
New Conventional
Estimated Equity
$241,862
Purchase Details
Closed on
Mar 24, 1999
Sold by
Thompson Eva
Bought by
Thompson Eva and Walters Elizabeth P
Purchase Details
Closed on
Jul 13, 1995
Sold by
Hud
Bought by
Thompson Eva
Home Financials for this Owner
Home Financials are based on the most recent Mortgage that was taken out on this home.
Original Mortgage
$48,598
Interest Rate
7.63%
Mortgage Type
FHA
Purchase Details
Closed on
Jan 26, 1995
Sold by
Keycorp Mtg Inc
Bought by
Hud
Purchase Details
Closed on
Jan 3, 1995
Sold by
Garcia Jorge Antonio and Keycorp Mtg Inc
Bought by
Keycorp Mtg Inc
Create a Home Valuation Report for This Property
The Home Valuation Report is an in-depth analysis detailing your home's value as well as a comparison with similar homes in the area
Home Values in the Area
Average Home Value in this Area
Purchase History
| Date | Buyer | Sale Price | Title Company |
|---|---|---|---|
| Ryan Gabriella | $150,000 | Chicago Title | |
| Thompson Eva | -- | -- | |
| Thompson Eva | $49,000 | Fidelity National Title Ins | |
| Hud | -- | Fidelity National Title Ins | |
| Keycorp Mtg Inc | $81,919 | World Title Company |
Source: Public Records
Mortgage History
| Date | Status | Borrower | Loan Amount |
|---|---|---|---|
| Open | Ryan Gabriella | $120,000 | |
| Previous Owner | Thompson Eva | $48,598 |
Source: Public Records
Tax History Compared to Growth
Tax History
| Year | Tax Paid | Tax Assessment Tax Assessment Total Assessment is a certain percentage of the fair market value that is determined by local assessors to be the total taxable value of land and additions on the property. | Land | Improvement |
|---|---|---|---|---|
| 2025 | $1,737 | $156,060 | $31,212 | $124,848 |
| 2024 | $1,737 | $153,000 | $30,600 | $122,400 |
| 2023 | $1,718 | $150,000 | $30,000 | $120,000 |
| 2022 | $780 | $76,706 | $23,481 | $53,225 |
| 2021 | $764 | $75,202 | $23,021 | $52,181 |
| 2020 | $754 | $74,431 | $22,785 | $51,646 |
| 2019 | $737 | $72,971 | $22,338 | $50,633 |
| 2018 | $721 | $71,540 | $21,900 | $49,640 |
| 2017 | $707 | $70,138 | $21,471 | $48,667 |
| 2016 | $690 | $68,763 | $21,050 | $47,713 |
| 2015 | -- | $67,730 | $20,734 | $46,996 |
| 2014 | $669 | $66,403 | $20,328 | $46,075 |
Source: Public Records
Map
Nearby Homes
- 17665 Juniper St
- 17537 Main St
- 17578 Walnut St
- 17616 Walnut St
- 17801 Chestnut St
- 17443 Walnut St
- 17761 Pine St
- 32 H Ave
- 17911 Juniper St
- 17805 Walnut St
- 17810 Pine St
- 8998 Avocado Ave
- 17615 Sultana St
- 17798 Cherry St
- 8951 Grapefruit Ave
- 8960 Buckthorn Ave
- 8871 Avocado Ave
- 18060 Walnut St
- 17520 Aspen St
- 9535 Timberlane Ave
- 17618 Yucca St
- 17632 Yucca St
- 17611 Juniper St
- 17627 Juniper St
- 17597 Juniper St
- 17595 Yucca St
- 17581 Yucca St
- 17613 Yucca St
- 17643 Juniper St
- 17648 Yucca St
- 17565 Yucca St
- 9292 Ponderosa Ave
- 9306 Ponderosa Ave
- 9318 Ponderosa Ave
- 17662 Yucca St
- 17551 Yucca St
- 17645 Yucca St
- 9336 Ponderosa Ave
- 17671 Juniper St