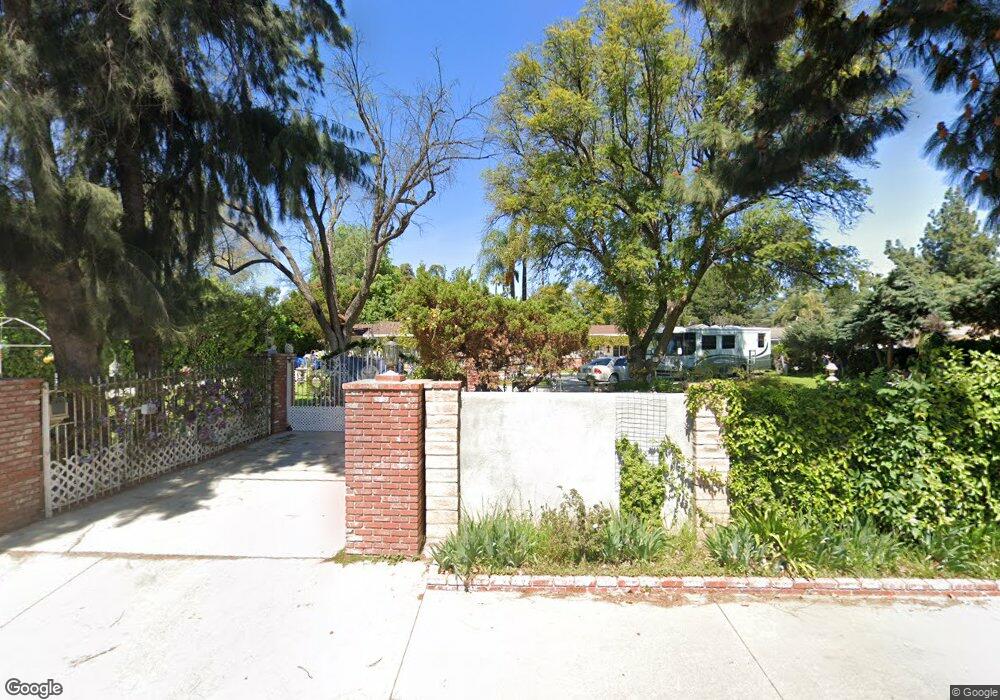
17619 Parthenia St Northridge, CA 91325
Estimated Value: $1,384,484 - $1,687,000
4
Beds
2
Baths
2,545
Sq Ft
$598/Sq Ft
Est. Value
About This Home
This home is located at 17619 Parthenia St, Northridge, CA 91325 and is currently estimated at $1,522,371, approximately $598 per square foot. 17619 Parthenia St is a home located in Los Angeles County with nearby schools including Oliver Wendell Holmes Middle School, Northridge Academy High, and Valley Academy of Arts & Sciences.
Ownership History
Date
Name
Owned For
Owner Type
Purchase Details
Closed on
Aug 9, 2003
Sold by
Garcia Benny H and Garcia Martha G
Bought by
Garcia Benny H
Current Estimated Value
Purchase Details
Closed on
Feb 17, 2000
Sold by
Garcia Benny R and Garcia Martha G
Bought by
Garcia Benny R and Garcia Martha G
Purchase Details
Closed on
Nov 29, 1994
Sold by
Zilverberg Barak
Bought by
Garcia Benny H
Home Financials for this Owner
Home Financials are based on the most recent Mortgage that was taken out on this home.
Original Mortgage
$118,000
Interest Rate
3.87%
Purchase Details
Closed on
Oct 18, 1994
Sold by
Bluebonnet Svgs Bank Fsb
Bought by
Zilverberg Barak
Home Financials for this Owner
Home Financials are based on the most recent Mortgage that was taken out on this home.
Original Mortgage
$118,000
Interest Rate
3.87%
Purchase Details
Closed on
Aug 23, 1994
Sold by
Marcial Frank X and Marcial Carolyn J
Bought by
Bluebonnet Svgs Bank Fsb
Create a Home Valuation Report for This Property
The Home Valuation Report is an in-depth analysis detailing your home's value as well as a comparison with similar homes in the area
Home Values in the Area
Average Home Value in this Area
Purchase History
| Date | Buyer | Sale Price | Title Company |
|---|---|---|---|
| Garcia Benny H | -- | -- | |
| Garcia Benny R | -- | Southland Title Corporation | |
| Garcia Benny H | $188,000 | Old Republic Title | |
| Zilverberg Barak | $130,000 | Western Cities Title | |
| Bluebonnet Svgs Bank Fsb | -- | Old Republic Title |
Source: Public Records
Mortgage History
| Date | Status | Borrower | Loan Amount |
|---|---|---|---|
| Closed | Garcia Benny H | $118,000 |
Source: Public Records
Tax History Compared to Growth
Tax History
| Year | Tax Paid | Tax Assessment Tax Assessment Total Assessment is a certain percentage of the fair market value that is determined by local assessors to be the total taxable value of land and additions on the property. | Land | Improvement |
|---|---|---|---|---|
| 2025 | $4,501 | $315,749 | $262,016 | $53,733 |
| 2024 | $4,501 | $309,559 | $256,879 | $52,680 |
| 2023 | $4,511 | $303,491 | $251,843 | $51,648 |
| 2022 | $4,332 | $297,541 | $246,905 | $50,636 |
| 2021 | $4,273 | $291,708 | $242,064 | $49,644 |
| 2019 | $4,164 | $283,057 | $234,885 | $48,172 |
| 2018 | $3,788 | $277,508 | $230,280 | $47,228 |
| 2016 | $3,523 | $266,734 | $221,339 | $45,395 |
| 2015 | $3,475 | $262,729 | $218,015 | $44,714 |
| 2014 | $3,505 | $257,584 | $213,745 | $43,839 |
Source: Public Records
Map
Nearby Homes
- 17545 Parthenia St
- 8760 White Oak Ave
- 17800 Raymer St
- 17912 Parthenia St
- 17151 & 17149 W Lassen St
- 17441 Rayen St
- 17350 Osborne St
- 8944 Enfield Ave
- 18022 Raymer St
- 17437 Chase St
- 18041 Acre St
- 8401 Jamieson Ave
- 8502 Newcastle Ave
- 8503 Newcastle Ave
- 17190 Gresham St
- 8300 Zelzah Ave
- 18154 Gresham St
- 8954 Chimineas Ave
- 17956 Schoenborn St
- 8421 Lindley Ave
- 17607 Parthenia St
- 17637 Parthenia St
- 8729 Shoshone Ave
- 17624 Parthenia St
- 8656 Jellico Ave
- 8741 Shoshone Ave
- 8730 White Oak Ave
- 17600 Parthenia St
- 8740 White Oak Ave
- 17654 Parthenia St
- 8643 Jellico Ave
- 8644 Jellico Ave
- 8750 White Oak Ave
- 17632 Parthenia St
- 17552 Parthenia St
- 17703 Parthenia St
- 8746 Shoshone Ave
- 8757 Shoshone Ave
- 17544 Parthenia St
- 8631 Jellico Ave