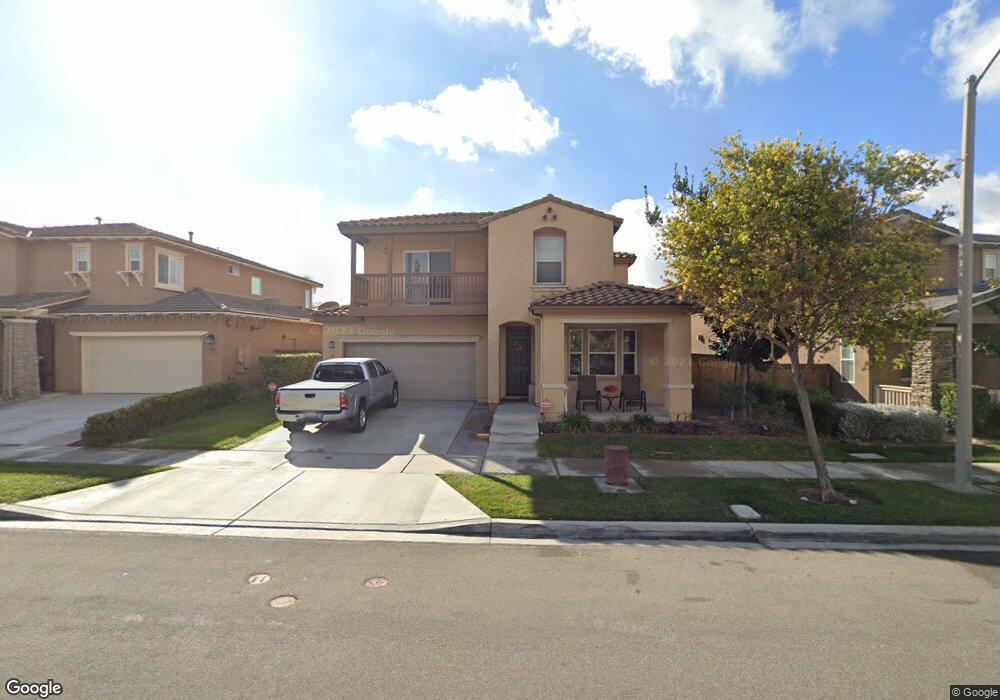
1762 Webber Way Chula Vista, CA 91913
Otay Ranch NeighborhoodEstimated Value: $990,000 - $1,059,000
3
Beds
3
Baths
2,503
Sq Ft
$409/Sq Ft
Est. Value
About This Home
This home is located at 1762 Webber Way, Chula Vista, CA 91913 and is currently estimated at $1,023,004, approximately $408 per square foot. 1762 Webber Way is a home with nearby schools including Wolf Canyon Elementary School, Rancho Del Rey Middle School, and Olympian High School.
Ownership History
Date
Name
Owned For
Owner Type
Purchase Details
Closed on
Jul 29, 2014
Sold by
Valencia Joseph F and Valencia Maryann U
Bought by
Valencia Joseph F and Valencia Maryann Umayam
Current Estimated Value
Home Financials for this Owner
Home Financials are based on the most recent Mortgage that was taken out on this home.
Original Mortgage
$490,842
Outstanding Balance
$374,406
Interest Rate
4.12%
Mortgage Type
VA
Estimated Equity
$648,598
Purchase Details
Closed on
Apr 2, 2013
Sold by
Mcmillin Indigo Ii Llc
Bought by
Valencia Joseph F and Valencia Maryann U
Home Financials for this Owner
Home Financials are based on the most recent Mortgage that was taken out on this home.
Original Mortgage
$489,600
Interest Rate
3.37%
Mortgage Type
VA
Purchase Details
Closed on
Jul 30, 2010
Sold by
Mcmillin Indigo Llc
Bought by
Mcmillin Indigo Ii Llc
Create a Home Valuation Report for This Property
The Home Valuation Report is an in-depth analysis detailing your home's value as well as a comparison with similar homes in the area
Home Values in the Area
Average Home Value in this Area
Purchase History
| Date | Buyer | Sale Price | Title Company |
|---|---|---|---|
| Valencia Joseph F | -- | Lawyers Title | |
| Valencia Joseph F | $474,000 | First American Title | |
| Mcmillin Indigo Ii Llc | $10,370,000 | First American Title |
Source: Public Records
Mortgage History
| Date | Status | Borrower | Loan Amount |
|---|---|---|---|
| Open | Valencia Joseph F | $490,842 | |
| Previous Owner | Valencia Joseph F | $489,600 |
Source: Public Records
Tax History
| Year | Tax Paid | Tax Assessment Tax Assessment Total Assessment is a certain percentage of the fair market value that is determined by local assessors to be the total taxable value of land and additions on the property. | Land | Improvement |
|---|---|---|---|---|
| 2025 | $10,296 | $581,033 | $196,130 | $384,903 |
| 2024 | $10,296 | $569,641 | $192,285 | $377,356 |
| 2023 | $10,165 | $558,472 | $188,515 | $369,957 |
| 2022 | $9,920 | $547,522 | $184,819 | $362,703 |
| 2021 | $9,787 | $536,788 | $181,196 | $355,592 |
| 2020 | $9,588 | $531,285 | $179,339 | $351,946 |
| 2019 | $10,794 | $520,869 | $175,823 | $345,046 |
| 2018 | $10,557 | $510,657 | $172,376 | $338,281 |
| 2017 | $10,367 | $500,646 | $168,997 | $331,649 |
| 2016 | $9,878 | $490,831 | $165,684 | $325,147 |
| 2015 | $9,516 | $483,459 | $163,196 | $320,263 |
| 2014 | $9,483 | $473,990 | $160,000 | $313,990 |
Source: Public Records
Map
Nearby Homes
- 1746 Webber Way
- 1802 Webber Way
- 1623 Lokoya Dr Unit 1
- 1738 Barbour Ave
- 1858 Wedgewood Place
- 1808 Cyan Ln
- 1683 Kincaid Ave
- 1679 Kincaid Ave
- 1613 Jones St
- 1658 Kincaid Ave
- 1939 Minimalist Ln
- 1939 Strata St
- 1856 Focus Dr
- 1922 Strata St Unit 8
- 2003 Caminito de la Cruz
- 1516 San Borja St Unit 1
- 1830 Ascella Dr Unit 6
- 1518 Caminito Soria Unit 2
- 1510 El Prado St Unit 1
- 1892 Monaco Dr
- 1758 Webber Way
- 1766 Webber Way
- 1752 Webber Way
- 1751 Jackson St
- 1750 Webber Way
- 1747 Jackson St
- 1770 Webber Way
- 1755 Jackson St
- 1743 Jackson St
- 1763 Webber Way
- 1757 Webber Way
- 1774 Webber Way
- 1761 Jackson St
- 1753 Webber Way
- 1739 Jackson St
- 1771 Webber Way
- 1749 Webber Way
- 1742 Webber Way
- 1765 Jackson St
- 1778 Webber Way
Your Personal Tour Guide
Ask me questions while you tour the home.