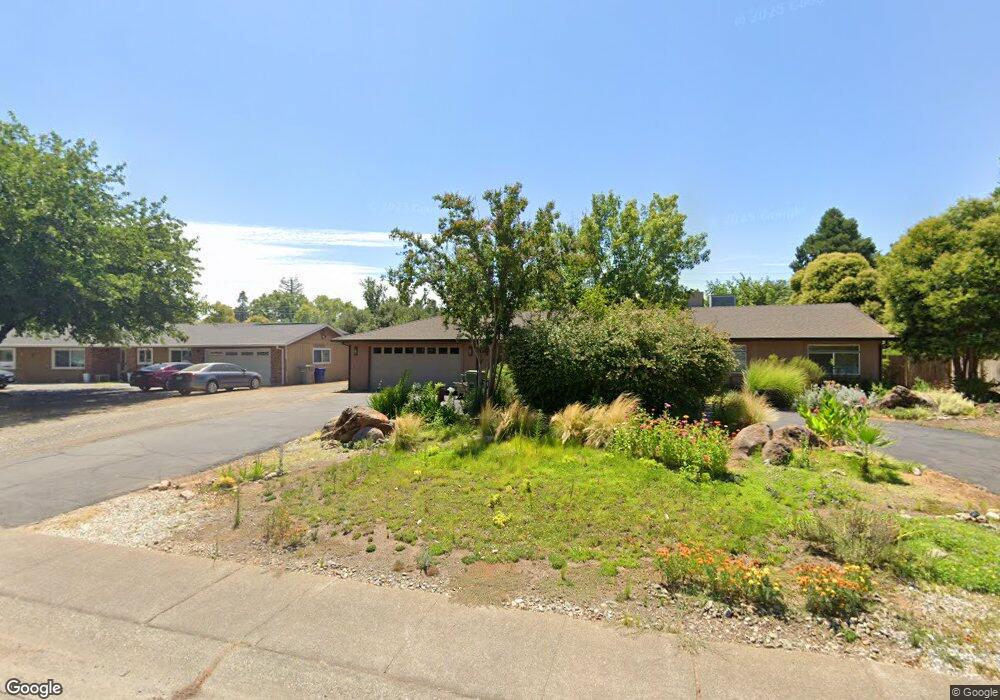
1763 Filaree Dr Redding, CA 96002
Alta Mesa NeighborhoodEstimated Value: $374,000 - $399,000
3
Beds
2
Baths
1,431
Sq Ft
$267/Sq Ft
Est. Value
About This Home
This home is located at 1763 Filaree Dr, Redding, CA 96002 and is currently estimated at $382,498, approximately $267 per square foot. 1763 Filaree Dr is a home located in Shasta County with nearby schools including Lassen View Elementary School, Parsons Junior High School, and Enterprise High School.
Ownership History
Date
Name
Owned For
Owner Type
Purchase Details
Closed on
Jan 29, 2021
Sold by
Laughlin Daniel L and Laughlin Dyanna
Bought by
Laughlin Daniel Leroy and Laughlin Dyanna
Current Estimated Value
Purchase Details
Closed on
Jul 14, 1999
Sold by
Cooley Robt & Twila Rev Trust
Bought by
Laughlin Daniel L and Laughlin Dyanna
Home Financials for this Owner
Home Financials are based on the most recent Mortgage that was taken out on this home.
Original Mortgage
$109,831
Outstanding Balance
$30,959
Interest Rate
7.64%
Mortgage Type
FHA
Estimated Equity
$351,539
Purchase Details
Closed on
Jul 23, 1997
Sold by
Cooley Robert D and Cooley Twila M
Bought by
Cooley Robert D and Cooley Twila M
Create a Home Valuation Report for This Property
The Home Valuation Report is an in-depth analysis detailing your home's value as well as a comparison with similar homes in the area
Home Values in the Area
Average Home Value in this Area
Purchase History
| Date | Buyer | Sale Price | Title Company |
|---|---|---|---|
| Laughlin Daniel Leroy | -- | None Available | |
| Laughlin Daniel L | $110,000 | Fidelity National Title Co | |
| Cooley Robert D | -- | -- |
Source: Public Records
Mortgage History
| Date | Status | Borrower | Loan Amount |
|---|---|---|---|
| Open | Laughlin Daniel L | $109,831 | |
| Closed | Laughlin Daniel L | $5,500 |
Source: Public Records
Tax History
| Year | Tax Paid | Tax Assessment Tax Assessment Total Assessment is a certain percentage of the fair market value that is determined by local assessors to be the total taxable value of land and additions on the property. | Land | Improvement |
|---|---|---|---|---|
| 2025 | $2,220 | $210,271 | $36,874 | $173,397 |
| 2024 | $2,187 | $206,149 | $36,151 | $169,998 |
| 2023 | $2,187 | $202,108 | $35,443 | $166,665 |
| 2022 | $2,124 | $198,147 | $34,749 | $163,398 |
| 2021 | $2,050 | $194,263 | $34,068 | $160,195 |
| 2020 | $2,041 | $192,272 | $33,719 | $158,553 |
| 2019 | $2,023 | $188,503 | $33,058 | $155,445 |
| 2018 | $1,998 | $184,808 | $32,410 | $152,398 |
| 2017 | $2,031 | $181,185 | $31,775 | $149,410 |
| 2016 | $1,899 | $177,633 | $31,152 | $146,481 |
| 2015 | $1,882 | $174,966 | $30,685 | $144,281 |
| 2014 | $1,867 | $171,539 | $30,084 | $141,455 |
Source: Public Records
Map
Nearby Homes
- 5142 Huntington Dr
- 4733 Fiddleneck Dr
- 99999 Churn Creek Rd
- 4648 Dandelion Dr
- 5521 Churn Creek Rd
- 4624 Columbine Dr
- 2195 Rancho Rd
- 4877 Squirrel Run Ct
- 4608 Dandelion Dr
- 4487 Alta Saga Dr
- 4724 Squirrel Run Ct
- 1289 Arizona St
- 4646 Alta Camino Dr
- 2364 La Madre Ct
- 8198 Green Acres Ln
- 2366 Templeton Dr
- 19278 Green Acres Ln W
- 4302 Paulson Ln
- 4323 Churn Crk Rd
- 2523 Uphill Ave
- 1777 Filaree Dr
- 1749 Filaree Dr
- 1791 Filaree Dr
- 1735 Filaree Dr
- 1756 Filaree Dr
- 5785 Churn Creek Rd
- 1770 Filaree Dr
- 5015 Debbie Ln Unit 1
- 5015 Debbie Ln
- 5751 Churn Creek Rd
- 1784 Filaree Dr
- 1742 Filaree Dr
- 5735 Churn Creek Rd
- 4963 Huntington Dr
- 1728 Filaree Dr
- 8384 Churn Creek Rd Unit 1
- 8384 Churn Creek Rd
- 1798 Filaree Dr
- 5037 Debbie Ln
- 5038 Debbie Ln
Your Personal Tour Guide
Ask me questions while you tour the home.