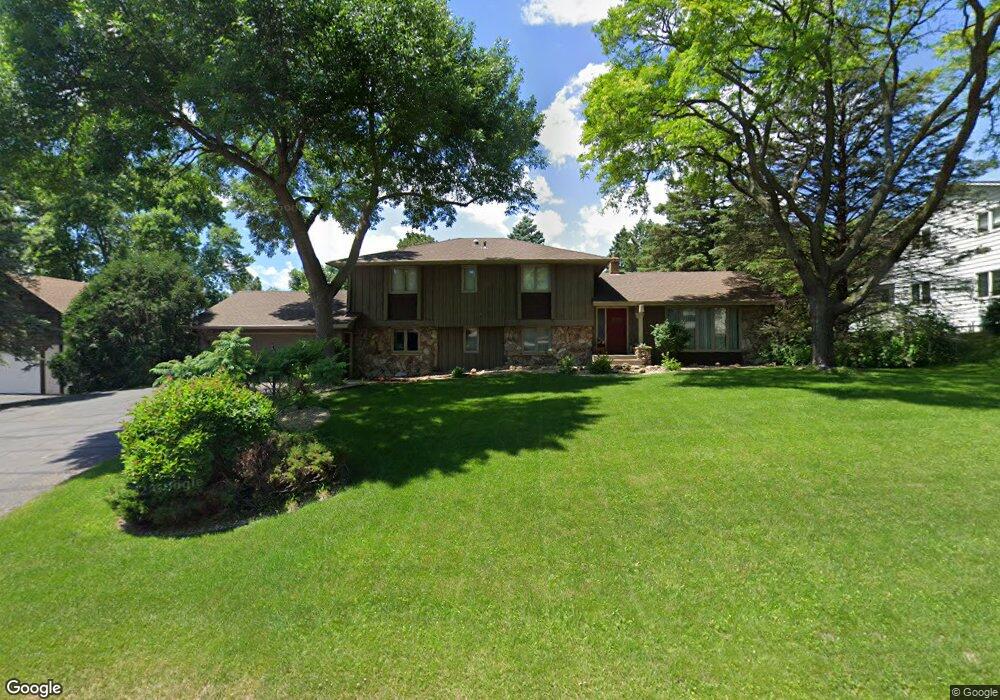
1763 Lansford Ln Saint Paul, MN 55118
Estimated Value: $558,000 - $708,000
4
Beds
3
Baths
3,436
Sq Ft
$192/Sq Ft
Est. Value
About This Home
This home is located at 1763 Lansford Ln, Saint Paul, MN 55118 and is currently estimated at $658,226, approximately $191 per square foot. 1763 Lansford Ln is a home located in Dakota County with nearby schools including Somerset Elementary School, Heritage E-STEM Magnet School, and Two Rivers High School.
Ownership History
Date
Name
Owned For
Owner Type
Purchase Details
Closed on
Nov 27, 2019
Sold by
Larsen Molly Howe and Larsen Colin M
Bought by
Jackson Bentley R and Jackson Nicole F
Current Estimated Value
Home Financials for this Owner
Home Financials are based on the most recent Mortgage that was taken out on this home.
Original Mortgage
$416,500
Outstanding Balance
$367,205
Interest Rate
3.6%
Mortgage Type
New Conventional
Estimated Equity
$291,021
Purchase Details
Closed on
Aug 30, 2016
Sold by
Howe Kevin P and Howe Mary Ann
Bought by
Larsen Colin M and Howe Molly E
Home Financials for this Owner
Home Financials are based on the most recent Mortgage that was taken out on this home.
Original Mortgage
$60,000
Interest Rate
3.94%
Mortgage Type
Land Contract Argmt. Of Sale
Create a Home Valuation Report for This Property
The Home Valuation Report is an in-depth analysis detailing your home's value as well as a comparison with similar homes in the area
Home Values in the Area
Average Home Value in this Area
Purchase History
| Date | Buyer | Sale Price | Title Company |
|---|---|---|---|
| Jackson Bentley R | $490,000 | Edina Realty Title Inc | |
| Larsen Molly Howe | $405,000 | Edina Realty Title Inc | |
| Larsen Colin M | $405,000 | None Available |
Source: Public Records
Mortgage History
| Date | Status | Borrower | Loan Amount |
|---|---|---|---|
| Open | Jackson Bentley R | $416,500 | |
| Previous Owner | Larsen Colin M | $60,000 |
Source: Public Records
Tax History Compared to Growth
Tax History
| Year | Tax Paid | Tax Assessment Tax Assessment Total Assessment is a certain percentage of the fair market value that is determined by local assessors to be the total taxable value of land and additions on the property. | Land | Improvement |
|---|---|---|---|---|
| 2024 | $5,992 | $657,800 | $172,200 | $485,600 |
| 2023 | $5,992 | $620,000 | $168,400 | $451,600 |
| 2022 | $5,038 | $603,500 | $168,000 | $435,500 |
| 2021 | $5,050 | $503,300 | $146,100 | $357,200 |
| 2020 | $5,112 | $498,400 | $139,100 | $359,300 |
| 2019 | $5,023 | $486,100 | $132,500 | $353,600 |
| 2018 | $4,763 | $453,500 | $123,800 | $329,700 |
| 2017 | $4,682 | $435,400 | $117,900 | $317,500 |
| 2016 | $4,643 | $412,700 | $112,200 | $300,500 |
| 2015 | $4,481 | $412,058 | $112,161 | $299,897 |
| 2014 | -- | $381,756 | $105,271 | $276,485 |
| 2013 | -- | $335,976 | $100,871 | $235,105 |
Source: Public Records
Map
Nearby Homes
- 1774 Dodd Rd
- 679 Marie Ave W
- 685 Hidden Creek Trail
- 792 Hilltop Rd
- 1941 Dodd Rd
- 884 Marie Ave W
- XXX Barbara Ct
- 614 Hidden Creek Trail
- 1912 South Ln
- 1626 Diane Rd
- 600 Wentworth Ave
- 1860 Eagle Ridge Dr Unit W303
- 912 Crown Ct
- 1759 Lilac Ln
- 1810 Delaware Ave
- 795 Creek Ave
- 485 Preserve Path
- 1320 Riverside Ln Unit 303
- 1320 Riverside Ln Unit 112
- 1328 Riverside Ln
- 1753 Lansford Ln
- 1769 Lansford Ln
- 1770 1770 Sutton Ln
- 1770 Sutton Ln
- 1758 Sutton Ln
- 121X Victoria Curve
- 175x Lilac Ln
- 1745 Lansford Ln
- 1780 Sutton Ln
- 1758 Lansford Ln
- 1766 Lansford Ln
- 1766 1766 Lansford Ln
- 1750 Sutton Ln
- 1742 Lansford Ln
- 724 Round Hill Rd
- 1786 Sutton Ln
- 1773 Sutton Ln
- 1765 Sutton Ln
- 1753 1753 Sutton Ln
- 1753 Sutton Ln