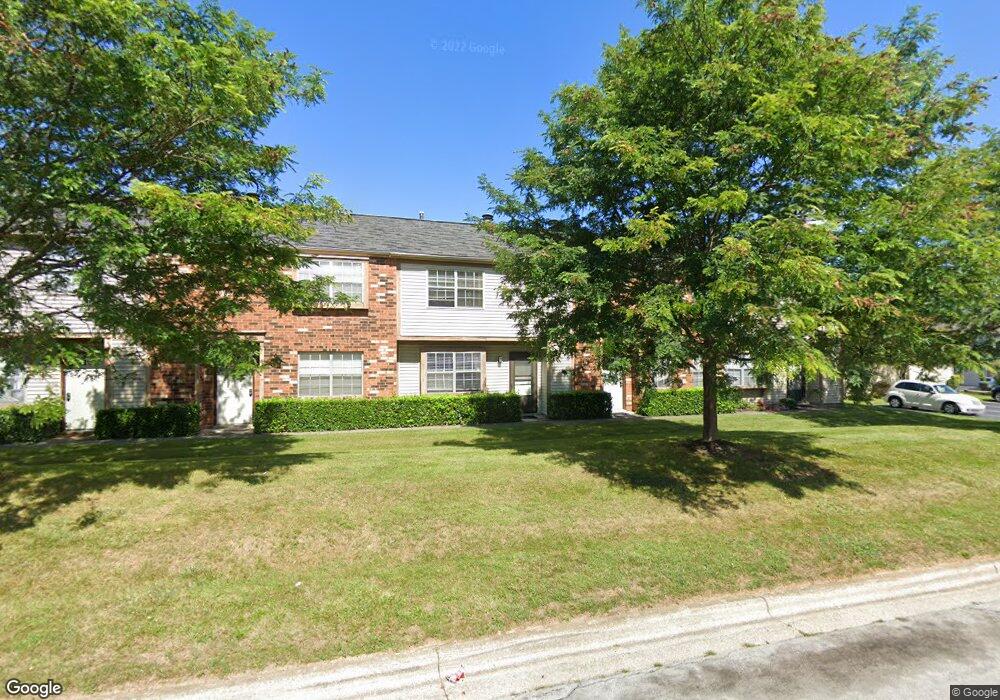
1763 Worthington Run Dr Unit A Columbus, OH 43235
Brookside Village NeighborhoodEstimated Value: $188,000 - $222,000
2
Beds
3
Baths
1,232
Sq Ft
$167/Sq Ft
Est. Value
About This Home
This home is located at 1763 Worthington Run Dr Unit A, Columbus, OH 43235 and is currently estimated at $206,067, approximately $167 per square foot. 1763 Worthington Run Dr Unit A is a home located in Franklin County with nearby schools including Brookside Elementary School, McCord Middle School, and Worthington Kilbourne High School.
Ownership History
Date
Name
Owned For
Owner Type
Purchase Details
Closed on
Apr 10, 2006
Sold by
Berton Jeffrey A
Bought by
Solis Seth R and Solis Stoyna
Current Estimated Value
Home Financials for this Owner
Home Financials are based on the most recent Mortgage that was taken out on this home.
Original Mortgage
$76,400
Outstanding Balance
$49,324
Interest Rate
8.6%
Mortgage Type
Fannie Mae Freddie Mac
Estimated Equity
$156,743
Purchase Details
Closed on
Jul 8, 1998
Sold by
Smith Mary Lee and Smith Dana A
Bought by
Berton Jeffrey A
Home Financials for this Owner
Home Financials are based on the most recent Mortgage that was taken out on this home.
Original Mortgage
$49,200
Interest Rate
7.17%
Mortgage Type
Purchase Money Mortgage
Purchase Details
Closed on
Nov 20, 1991
Create a Home Valuation Report for This Property
The Home Valuation Report is an in-depth analysis detailing your home's value as well as a comparison with similar homes in the area
Home Values in the Area
Average Home Value in this Area
Purchase History
| Date | Buyer | Sale Price | Title Company |
|---|---|---|---|
| Solis Seth R | $95,500 | Chicago Tit | |
| Berton Jeffrey A | $61,500 | Celtic Title Agency Inc | |
| -- | $43,000 | -- |
Source: Public Records
Mortgage History
| Date | Status | Borrower | Loan Amount |
|---|---|---|---|
| Open | Solis Seth R | $76,400 | |
| Closed | Berton Jeffrey A | $49,200 |
Source: Public Records
Tax History Compared to Growth
Tax History
| Year | Tax Paid | Tax Assessment Tax Assessment Total Assessment is a certain percentage of the fair market value that is determined by local assessors to be the total taxable value of land and additions on the property. | Land | Improvement |
|---|---|---|---|---|
| 2024 | $3,073 | $50,050 | $10,500 | $39,550 |
| 2023 | $2,938 | $50,050 | $10,500 | $39,550 |
| 2022 | $2,240 | $30,280 | $5,010 | $25,270 |
| 2021 | $2,067 | $30,280 | $5,010 | $25,270 |
| 2020 | $1,991 | $30,280 | $5,010 | $25,270 |
| 2019 | $1,696 | $23,280 | $3,850 | $19,430 |
| 2018 | $1,841 | $23,280 | $3,850 | $19,430 |
| 2017 | $1,520 | $23,280 | $3,850 | $19,430 |
| 2016 | $2,038 | $28,710 | $3,610 | $25,100 |
| 2015 | $2,039 | $28,710 | $3,610 | $25,100 |
| 2014 | $2,038 | $28,710 | $3,610 | $25,100 |
| 2013 | $1,014 | $28,700 | $3,605 | $25,095 |
Source: Public Records
Map
Nearby Homes
- 1721 Worthington Run Dr Unit 1721-1731
- 1637 Park Row Dr Unit F
- 1620 Park Row Dr Unit A
- 1930 Shallowford Ave
- 1889 Slaton Ct Unit 1889
- 1828 Gardenstone Dr
- 6921 Spruce Pine Dr
- 2001 Sawbury Blvd Unit 2001
- 2056 Fincastle Ct
- 2687 Snouffer Rd
- 1380 Tiehack Ct
- 2161 Heatherfield Ave
- 7164 Durness Place
- 2074 Hard Rd
- 2220 Surreygate Dr
- 7680 Foxboro Ln
- 7373 Palmleaf Ln
- 7734 Henry David Ct
- 2392 Dunsworth Dr
- 8108 Smoky Row Rd
- 1765 Worthington Run Dr Unit B
- 1767 Worthington Run Dr
- 1748 Queensbridge Dr Unit C
- 1769 Worthington Run Dr Unit D
- 1769 Worthington Run Dr
- 1750 Queensbridge Dr
- 1746 Queensbridge Dr Unit B
- 1744 Queensbridge Dr Unit A
- 1771 Worthington Run Dr Unit E
- 1752 Queensbridge Dr Unit E
- 1754 Queensbridge Dr Unit F
- 1773 Worthington Run Dr
- 1773 Worthington Run Dr Unit F
- 1779 Worthington Run Dr Unit AF
- 1759 Worthington Run Dr
- 1781 Worthington Run Dr
- 1758 Queensbridge Dr
- 1757 Worthington Run Dr
- 1783 Worthington Run Dr
- 1755 Worthington Run Dr